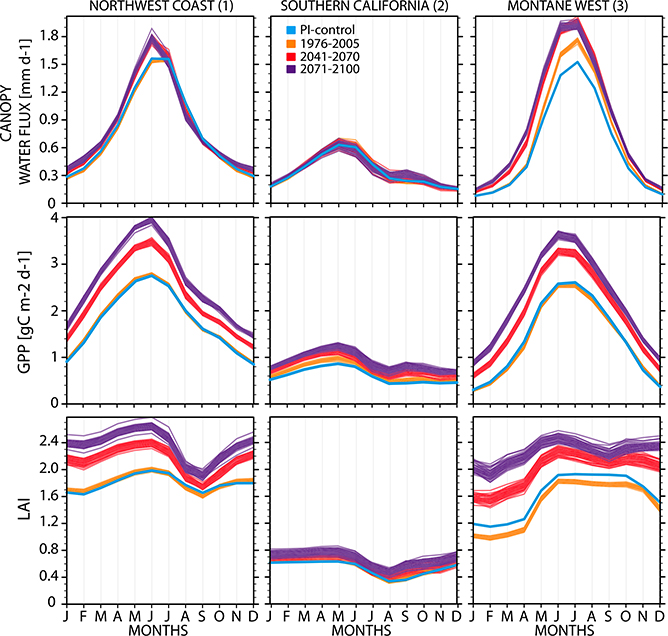
Fig. 11.
Seasonal cycles (January-December) of (top) net canopy water flux (sum of canopy evaporation and transpiration), (middle) gross primary productivity (GPP), and (bottom) leaf area index (LAI) for each region: (left) Northwest Coast, (center) Southern California, and (right) the Montane West. For each panel, four seasonal climatologies are shown for all ensemble members, that for the PI-control in blue, the historical period (1976–2005) in orange, mid-twenty-first century (2041–70) in red, and the end of the twenty-first century (2071–2100) in purple.

