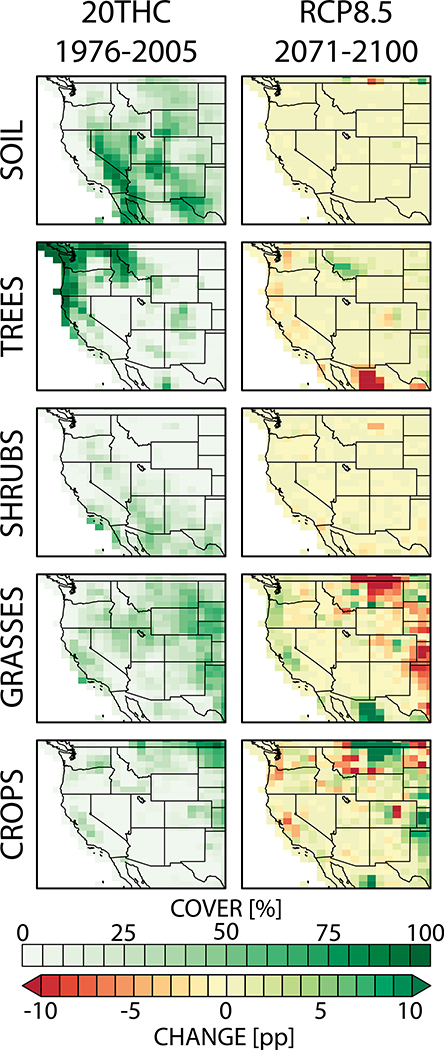
Fig. 12.
Prescribed land cover changes in the LENS. We aggregate the 15 plant functional types in CLM into four vegetation classes plus soil cover (from top to bottom). The late-twentieth-century land cover grid cell percentages in each class are shown at left and the end-of-century change in that grid cell percentage, as a percentage point change (pp), at right. Note that there is no biogeography in this set of simulations; all PFTs and their changes are prescribed as boundary conditions.

