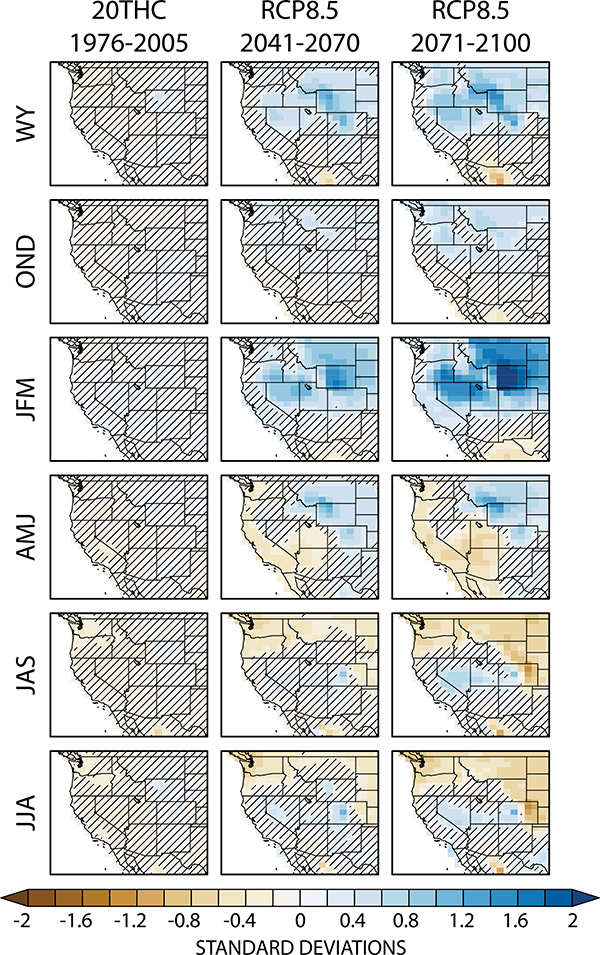
Fig. 3.
Precipitation response to anthropogenic forcing [(left) historical, (center) RCP8.5 midcentury, and (right) RCP8.5 end-of-century]. We show (top)–(bottom) the WY (October–August), October–December (OND), JFM, AMJ, July–September (JAS), and JJA seasonal means. Each panel shows the ensemble mean of each run’s 30-yr average time series standardized to the 1800-yr PI-control simulation mean and standard deviation. Insignificant change is denoted with hatching.

