Fig. 6.
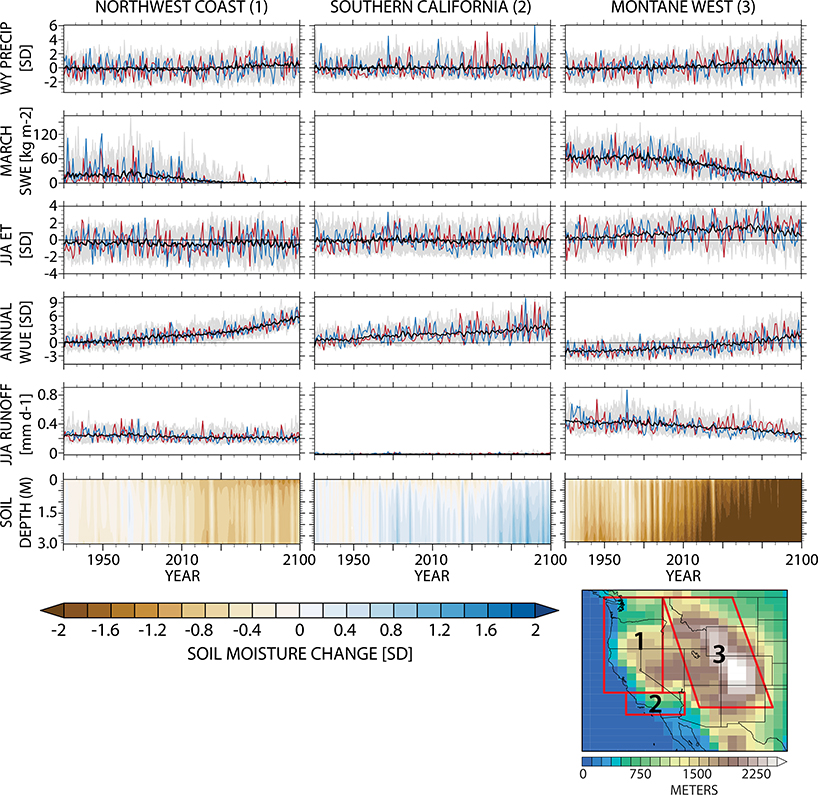
Regional time series of change, 1920–2100. For each region—(left) the Northwest Coast, (center) Southern California, and (right) the Montane West—we show the LENS time series of WY (October-August) precipitation (standardized), March snowpack (kg m−2), JJA evapotranspiration (ET, standardized), annual water-use efficiency (WUE, standardized), and JJA runoff (mm day−1). (bottom) Contours of soil moisture as a function of depth and time. The five panels from top show the time series for each ensemble member (gray) and the ensemble mean (black). We also highlight the ensemble member with the largest Theil-Sen (T-S) linear trend estimate (red) and the smallest T-S estimate (blue). All series show change relative to the 1800-yr PI-control simulation. Inset map shows the regional domains and CESM CAM5 elevation (in m).

