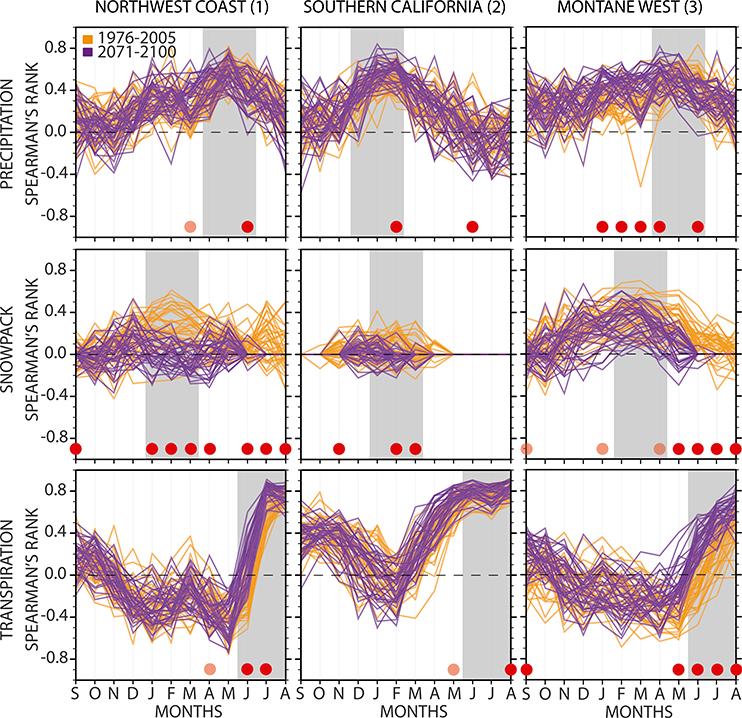
Fig. 8.
Monthly Spearman’s rank correlations of (top) precipitation, (middle) snowpack, and (bottom) transpiration with summer (JJA) 0–2.86-m soil moisture (except for Southern California, where we use the bottom layer, 2.86 m) for (left)–(right) the Northwest Coast, Southern California, and the Montane West. For the months preceding the JJA soil moisture (September–August), we show the ensemble range in correlations in two 30-yr time periods: historical (1976–2005, orange color) and the future (2071–2100, purple color). Months with statistically significant differences based on a bootstrapped K-S test in the ensemble distributions between historical and future are denoted with dark red dots (1% level) and light red dots (5% level) at the bottom of each panel. We also highlight in gray the months chosen for correlations presented in Fig. 9, which is based on the ensemble mean historical peak correlation.

