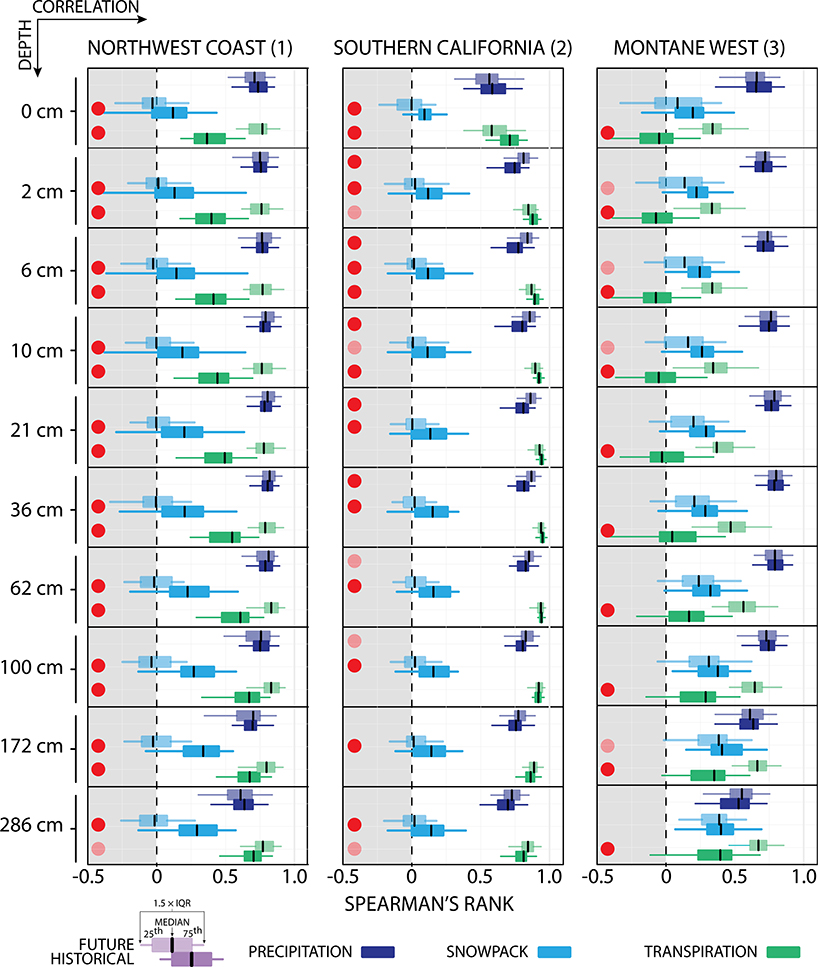
Fig. 9.
Spearman’s rank correlation between JJA soil moisture as a function of soil level, variable, and time period (historical 1975–2005, future 2071–2100) for (left) the Northwest Coast, (center) Southern California, and (right) the Montane West. The standard box plots show the ensemble range in 30-yr correlations of area-weighted average detrended standardized time series in the selected variable with JJA soil moisture. The seasonal average used is based on the Fig. 8, which highlighted peak seasonal correlations: for the Northwest Coast and the Montane West, AMJ precipitation; for Southern California, DJF precipitation; also, for the Northwest Coast and Southern California, JFM snowpack, for the Montane West, February–April (FMA) snowpack. All regions show JJA transpiration. Dark red dots show variables with statistically significant correlation distributions at the 1% level based on a bootstrapped K-S test; light red dots show significance at the 5% level.

