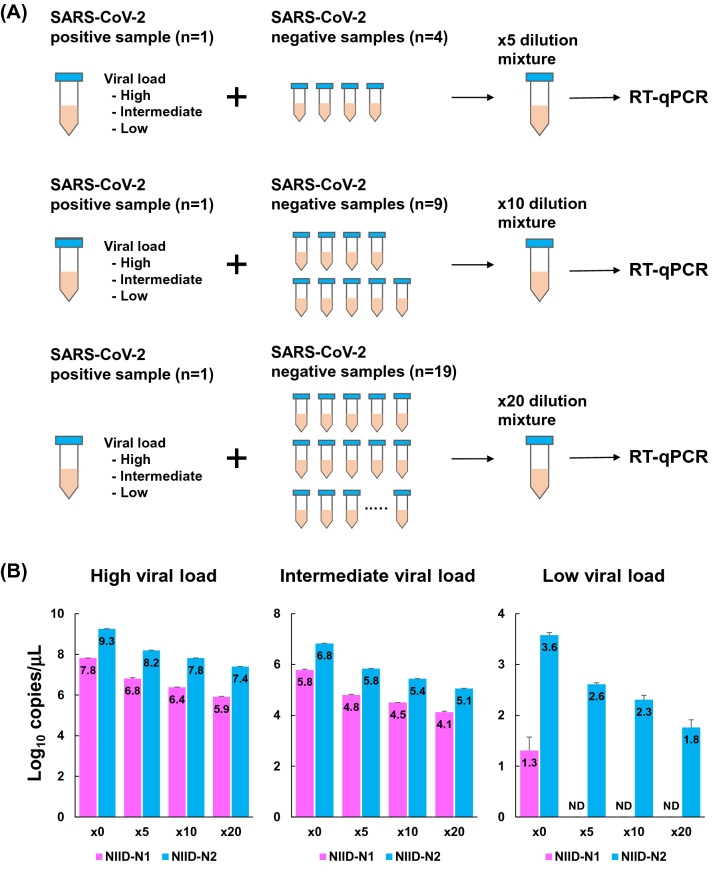
Figure 2.
Spike-in assay using SARS-CoV-2-positive and -negative nasopharyngeal swabs from patients. (A) Scheme of preparing spike-in solutions. SARS-CoV-2-positive samples with high, intermediate and low viral copies were used. These different viral loads were diluted with 4, 9 and 19 SARS-CoV-2-negative samples. The final solution was made at × 5, × 10 and × 20 dilutions and used for RT-qPCR analysis. (B) RT-qPCR analysis determined the copy numbers in the spike-in solutions. Each of the three patients had a different viral load corresponding to low, intermediate, and high. These SARS-CoV-2 positive samples were diluted with negative samples. The assay was used with NIID-N1 (pink) and NIID-N2 (blue). Bar plot shows the copy number (log10 copies/μL) in original (× 0) and diluted (× 5, × 10 and × 20) samples. All data represent the mean ± SD.

