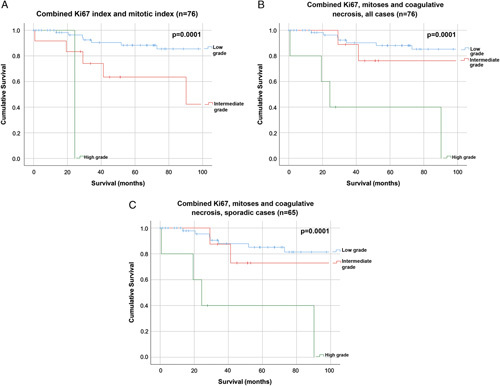
FIGURE 3.

Kaplan-Meier survival curves for combined Ki-67 index and mitotic count (n=76) (A); combined Ki-67 index, mitotic count, and coagulative necrosis in all cases (n=76) (B); and combined Ki-67 index, mitotic count, and coagulative necrosis in sporadic MTC cases only (n=65) (C).
