
Figure 1.
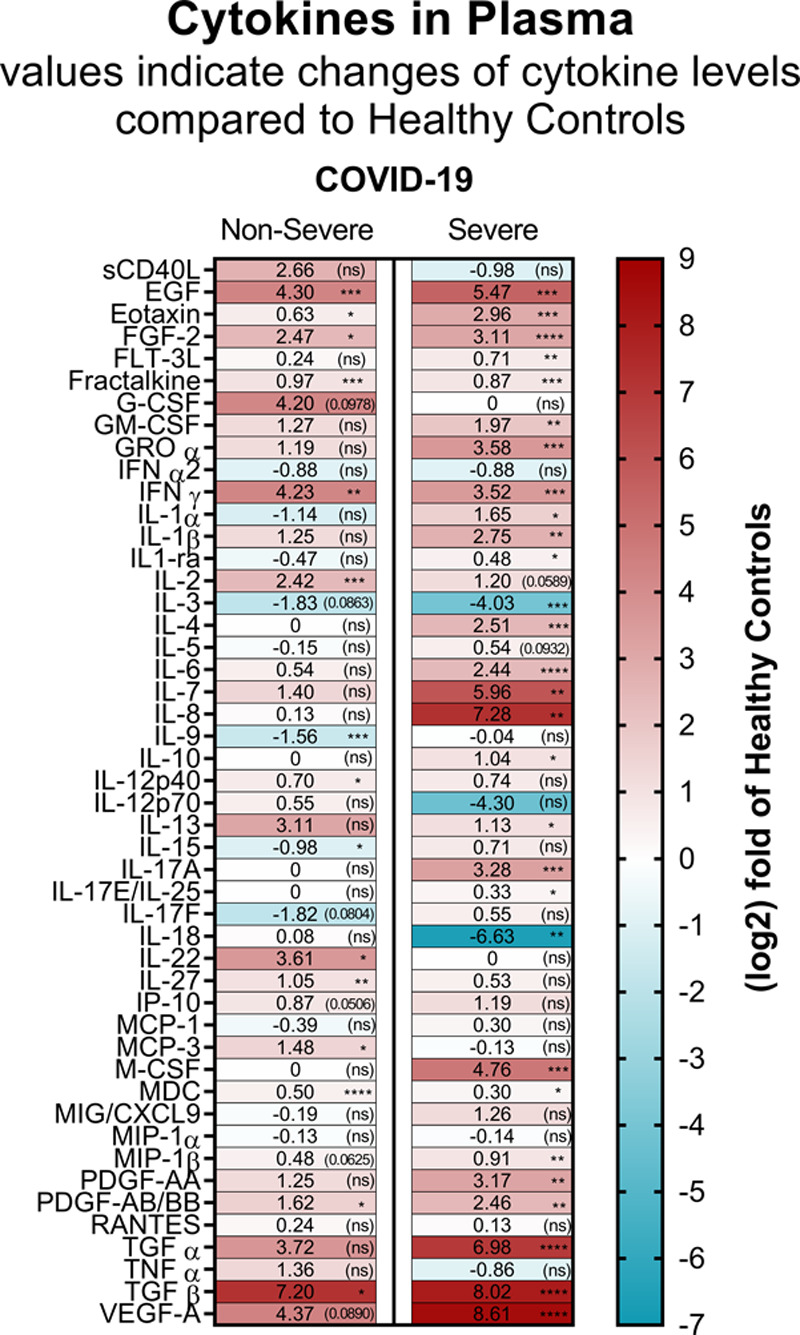
Cytokine and chemokine levels in plasma from patients with coronavirus disease 2019 (COVID-19). Heat map visualization of 48 cytokine/chemokine expression profiles in plasma of patients with COVID-19 nonsevere (median of n=10) and severe (median of n=9) relatively to the healthy controls (median of n=10). Cytokine/chemokine expression is represented as a (log2) fold change relative to healthy controls. The numbers in each part represent the change and statistical significance (in brackets), and the color codes refer to red for increased expression and blue for decreased expression. Absolute cytokine/chemokine values (pg/mL) and details on the statistical analysis are shown in Figure VII in the Data Supplement. *P<0.05, **P<0.01, ***P<0.001, ****P<0.0001.