
Figure 3.
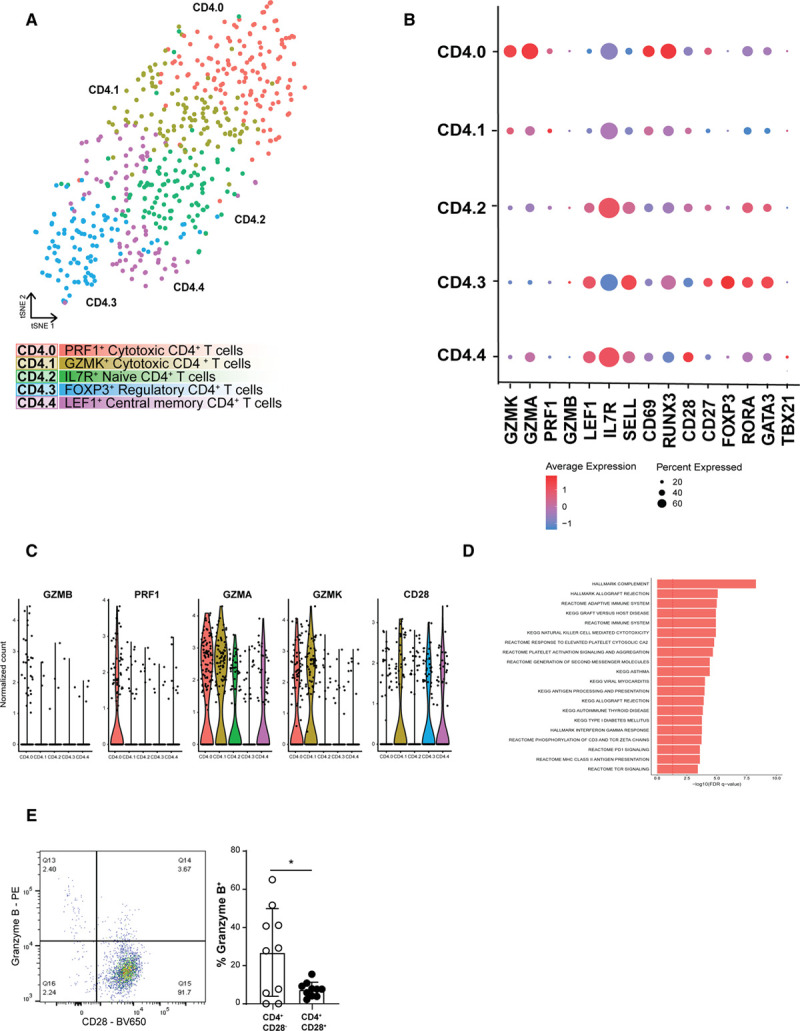
Subclustering of CD4+ T cells revealed 5 distinct populations. A, tSNE visualization of clustering revealed 5 distinct CD4+ T-cell populations. B, Dot plot of cluster-identifying genes and T-cell transcription factors. C, Violin plots of CD4.0 characterizing cytotoxic genes. D, Flow cytometry analysis of Granzyme B production by CD4+CD28− cells on defrosted plaque samples. E, Top pathways associated with cluster CD4.0. Data shown as mean±SD (n=10; obtained from cohort 1 and 2). *P<0.05. FDR indicates false discovery rate; FOXP3, forkhead box P3; GZMK, granzyme K; IL7R, interleukin 7 receptor; KEGG, Kyoto encyclopedia of genes and genomes; LEF1, lymphoid enhancer-binding factor 1; PD1, programmed cell death protein 1;PRF1, perforin 1; TCR, T cell receptor; and tSNE, t-distributed stochastic neighbor embedding.