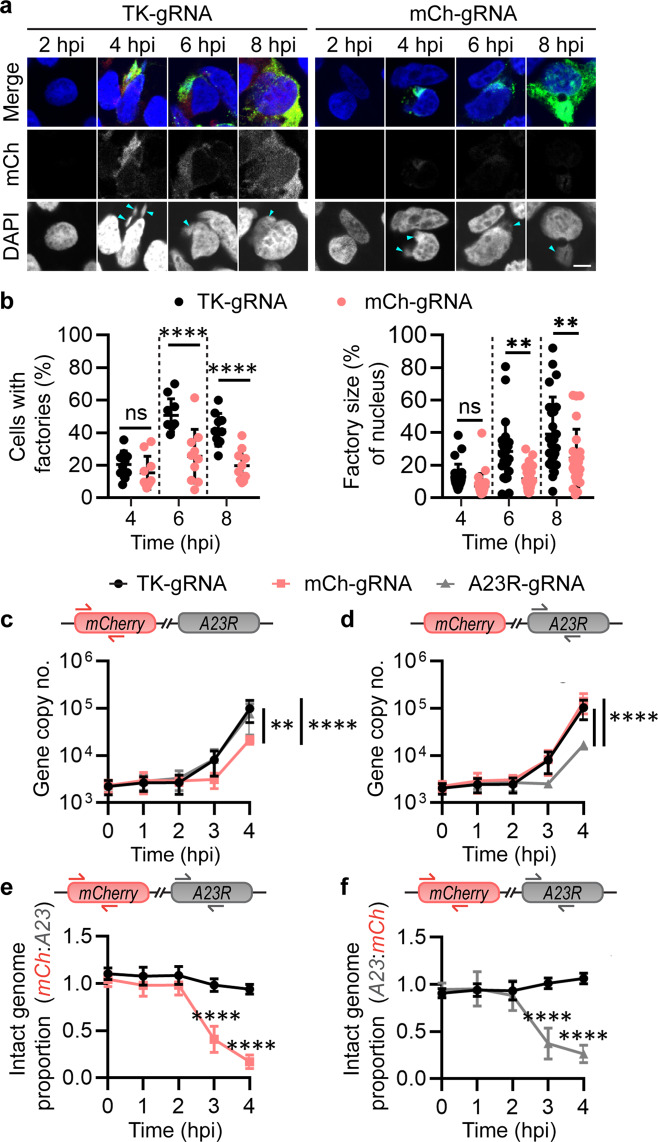
Fig. 4. VACV genome targeting occurs prior to viral factory formation and replication.
a, b Cultures were transfected overnight with Cas9/gRNAs and infected with VACV-mCh (MOI 0.5) for analysis of viral factory formation at the times shown. a Immunofluorescence images confirmed infection via anti-VACV primary and anti-rabbit FITC staining (green). Nuclei and virus factories (arrows) visualised with DAPI (blue). Images are representative of 3 independent experiments (scale bar = 5 μm). b Number of cells with factories (10 fields of view) and virus factory size relative to the nucleus (25 factories) were measured. Results are shown as means and SD (ns p > 0.05, **p = 0.0013 or 0.0073, ****p < 0.0001 by two-way ANOVA). c–f Cells were transfected overnight with Cas9/gRNAs then infected with VACV-mCh (MOI 1, 10 min) for qPCR analysis of genomes at the times shown after infection. Primers used for each qPCR assay are shown above each graph: mCherry (c) or A23R (d) for gene copy number measurements, or both (e, f) for analysis of ratios (means and SD shown; **p = 0.0023, ****p < 0.0001 by two-way ANOVA, n = 3).

