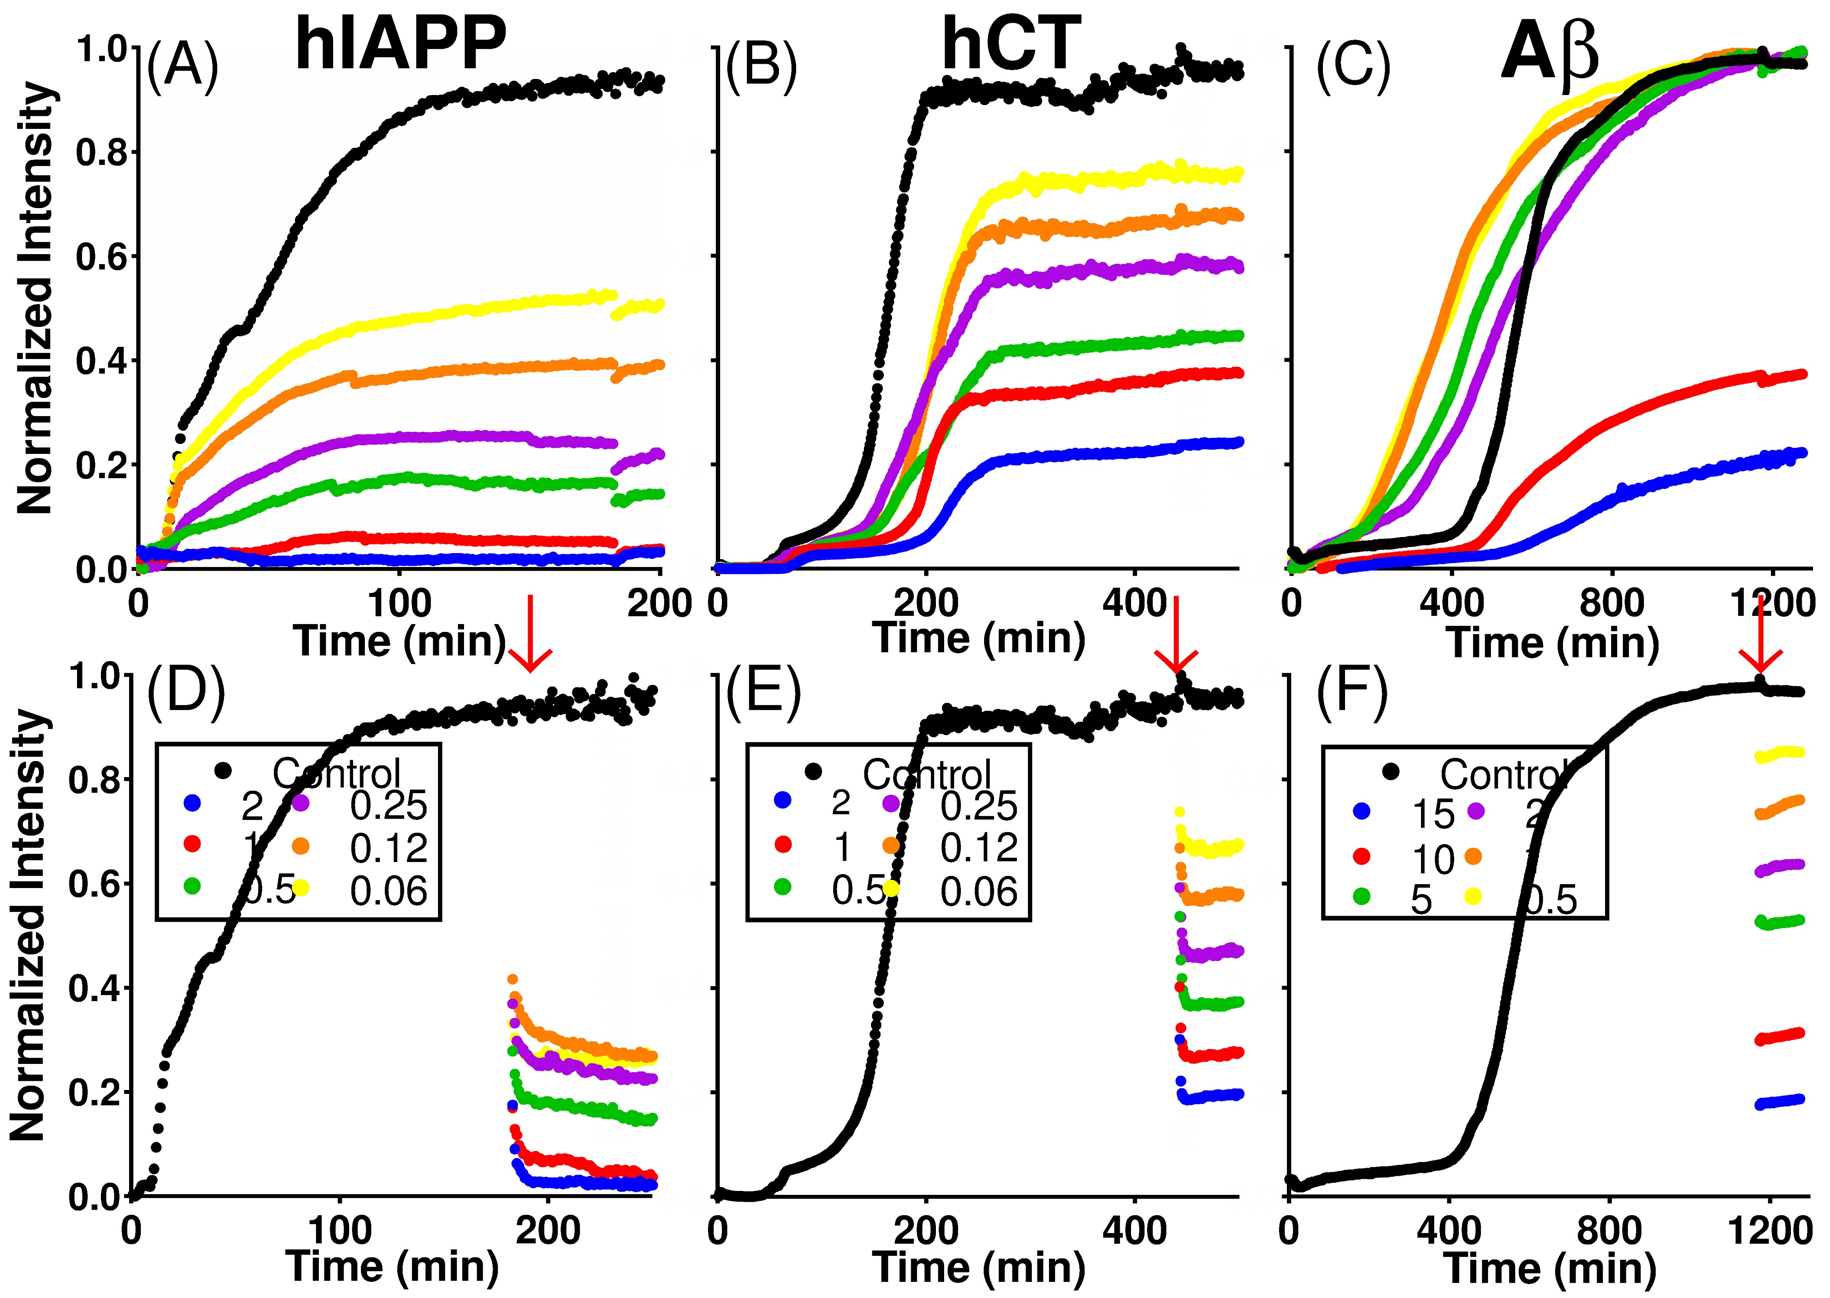
Figure 1.

Inhibition and disaggregation of amyloid peptides by CurDAc. Amounts of CurDAc added are given in molar equivalences with respect to the peptide concentration. ThT fluorescence inhibition curves (A-C) and disaggregation curves of hIAPP, hCT and Aβ1–40 (D-F, respectively) in the presence of varying molar equivalents of CurDAc. Red arrow indicates the time when CurDAc was added.
