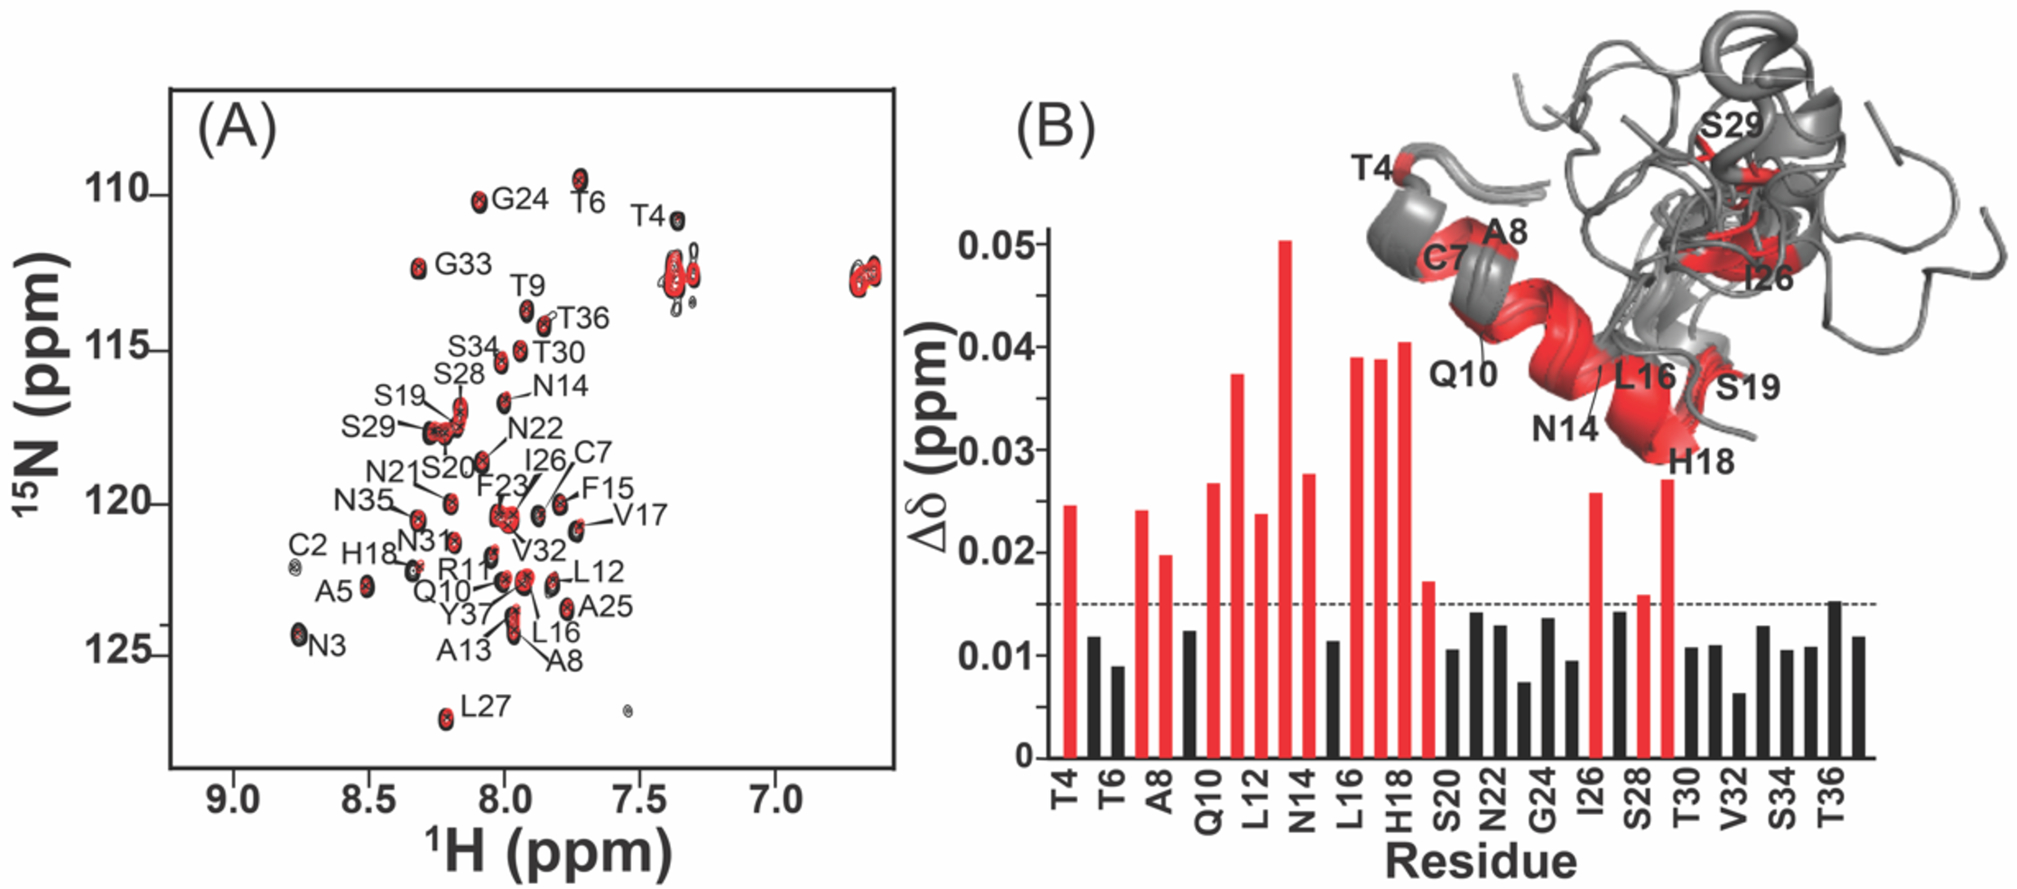
Figure 2.

hIAPP monomer and CurDAc interactions characterized by NMR. (A) 2D 1H/15N SOFAST-HMQC spectra exhibiting the interaction between 100 μM hIAPP (black) with 100 μM CurDAc (red). (B) CSPs for the backbone amide 15N and proton resonances as a function of the amino acid sequence position. The dashed line indicates the mean for the observed CSPs with the stronger shift changes above 0.015 (shown in red) highlighted on the monomer structure of hIAPP (PDB:5MGQ).
