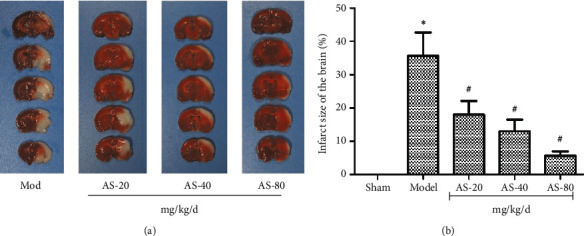
Figure 3.

(a) Representative images of 2,3,5-triphenyltetrazolium chloride staining sections after ischemia. (b) Infarct volumes in sham (n = 8), model (n = 8), 20 mg/kg AS-IV (n = 8), 40 mg/kg AS-IV (n = 8), and 80 mg/kg AS-IV (n = 8) groups. In (b), data are presented as the mean ± standard error of the mean. ∗P < 0.05 and ∗∗P < 0.01 vs. the model group.
