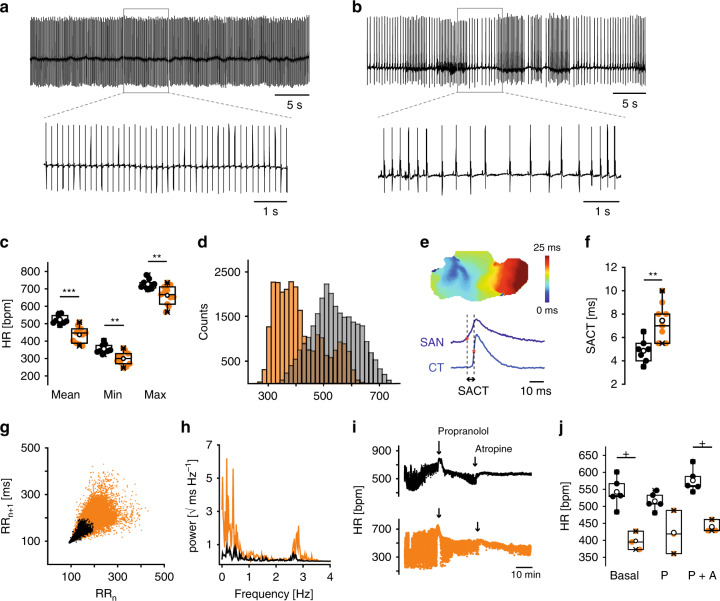
Fig. 3. HCN4FEA mice display bradycardia and sinus dysrhythmia.
a, b Telemetric ECG traces obtained from a conscious, freely moving a WT mouse and b HCN4FEA mouse. Insets: Extended ECG traces. c Mean, minimum, and maximum HR determined from 72-h RR intervals (WT: n = 9, HCN4FEA: n = 11; two-sided t-test; mean HR: p = 0.0019, min HR: p = 0.0040, max HR: p = 0.0383). d HR histograms of a WT (light gray) and HCN4FEA mouse (orange) determined from 72-h (12 h/12 h light/dark cycle) ECGs. e Determination of sinoatrial conduction time) with optical imaging measurements. Activation map of a biatrial WT SAN preparation (upper panel) and optical action potentials (OAP) (lower panel) from the leading pacemaker site in the SAN (dark blue) and from the earliest atrial excitation site within the crista terminalis (CT; light blue). SACT is determined as the time difference of activation time points indicated by asterisk. f SACT in WT and HCN4FEA SAN preparations (n = 7 WT + 8 HCN4FEA biologically independent samples; two-sided t-test; p = 0.0029). g Comet-shaped Poincaré plots in HCN4FEA mice (orange). h Frequency domain power spectral density plots obtained from a WT (black) and HCN4FEA (orange) mouse. i Tachograms of WT (black) and HCN4FEA (orange) mice before and after subsequent injection of propranolol (20 mg/kg i.p) and atropine (1 mg/kg i.p). Arrows indicate timepoint of injection (WT: n = 5, HCN4FEA: n = 3). j Mean basal HR and HR after successive injection of propranolol and atropine (n = 5 WT + 3 HCN4FEA animals; Mann–Whitney U test; basal: p = 0.03571, P: p = 0.07143, P + A: p = 0.03571). In vivo experiments were performed using male animals. In vitro experiments were performed using tissue isolated from female animals. Boxplots show the median line, perc 25/75, and min/max value; open symbols represent the mean value. Significance levels: *student´s paired t-test; +Mann–Whitney U test. Source data are provided as a Source Data file.

