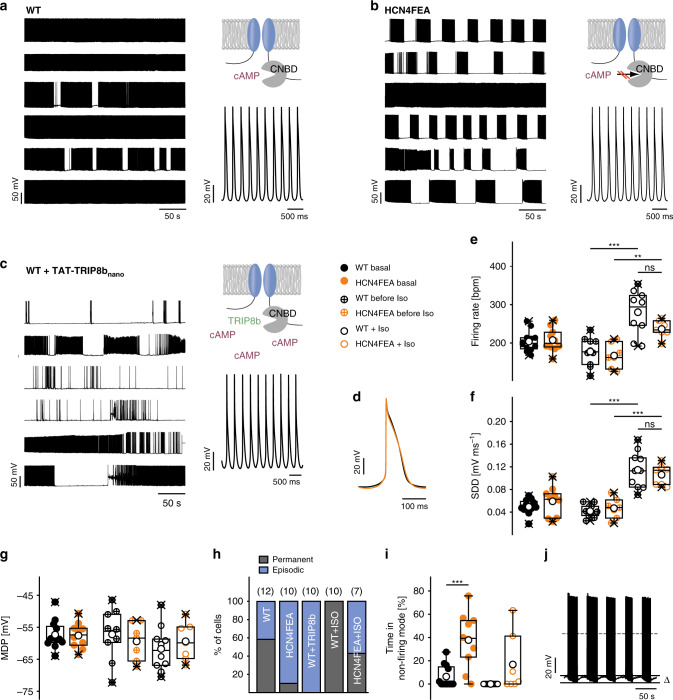
Fig. 4. Long-lasting periods of nonfiring in isolated pacemaker cells of HCN4FEA mice.
a–c (right, upper panel) Cartoons of channel variant used in experiments shown in the right panel. (Left panel) long-term perforated-patch-clamp recordings of spontaneous action potentials under baseline conditions in six SAN cells isolated from a WT and b HCN4FEA mice and c WT cells after application of TAT-TRIP8bnano. (Right, lower panel) Magnification of action potential recordings shown in the left panels. d Averaged action potentials obtained from representative perforated-patch-clamp recordings of a WT and HCN4FEA pacemaker cell. e–g firing rate (WT before Iso vs WT Iso: p = 0.000004; HCN4FEA before Iso vs HCN4FEA Iso: p = 0.0035; WT Iso vs HCN4FEA Iso: p = 0.0386), slope of slow diastolic depolarisation (SDD) (WT before Iso vs WT Iso: p = 0.00000003; HCN4FEA before Iso vs HCN4FEA Iso: p = 0.00002; WT Iso vs HCN4FEA Iso: p = 0.4315), and maximum diastolic potential (MDP) under basal conditions (n = 12 WT + 10 HCN4FEA cells) as well as before (n = 10 WT + 7 HCN4FEA cells) and during (n = 10 WT + 7 HCN4FEA cells) application of isoproterenol (100 nM). Values were determined from episodes with constant firing in WT and HCN4FEA cells. h Quantification of different firing patterns determined from similar recordings as shown in a–c (left panels). i Percentage of time spent in the nonfiring mode (basal n = 12 WT + 10 HCN4FEA cells, Iso n = 10 WT + 7 HCN4FEA cells; WT basal vs HCN4FEA basal: p = 0.0004). j Representative sequence of firing and nonfiring in an HCN4FEA pacemaker cell. The difference between MDP during firing and nonfiring was 7.14 ± 0.36 mV (ΔVm; n = 9). All experiments were performed using male animals. Boxplots show the median line, perc 25/75, and min/max value; open symbols represent the mean value. Significance levels: *Holm’s–Sidak post-hoc test following two-way ANOVA. Source data are provided as a Source Data file.

