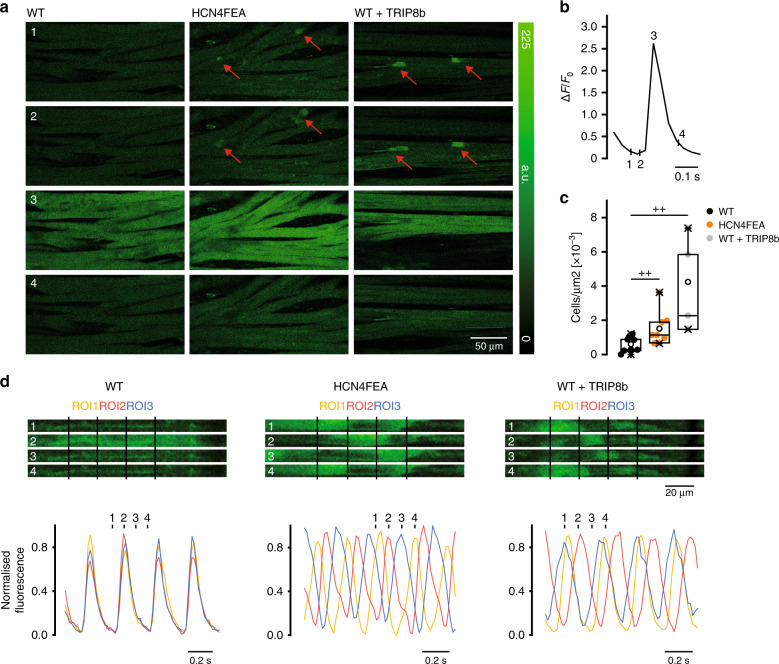
Fig. 6. Nonfiring pacemaker cells can be identified in the SAN network.
a Time-lapse of confocal calcium recordings (Fluo-4 AM; fluorescence in arbitrary units [a.u.]) of intact SAN explants of WT, HCN4FEA, and WT after application of TAT-TRIP8bnano (n = 7 WT + 8 HCN4FEA + 4 WT + TRIP8b biologically independent samples). Red arrows indicate subthreshold calcium signals. Images were taken at time points 1–4 during WT calcium transient shown in b. c Number of cells per µm2 displaying subthreshold calcium signals determined from the entire SAN region (n = 7 WT + 8 HCN4FEA + 4 WT + TRIP8b biologically independent samples; Mann–Whitney U test; WT vs HCN4FEA: p = 0.0330; WT vs WT + TRIP8b: p = 0.0040). d (upper panel) Time-lapse of confocal calcium recordings of intact SAN explants of WT, HCN4FEA, and WT after application of TAT-TRIP8bnano (n = 7 WT + 8 HCN4FEA + 4 WT + TRIP8b biologically independent samples). Images were taken at time points 1–4 indicated in the corresponding calcium transients (lower panel). Ca2+ transients were determined from indicated regions of interest (ROI). All experiments were performed using tissue isolated from female animals. Boxplots show the median line, perc 25/75, and min/max value; open symbols represent the mean value. Significance levels: +Mann–Whitney U test. Source data are provided as a Source Data file.

