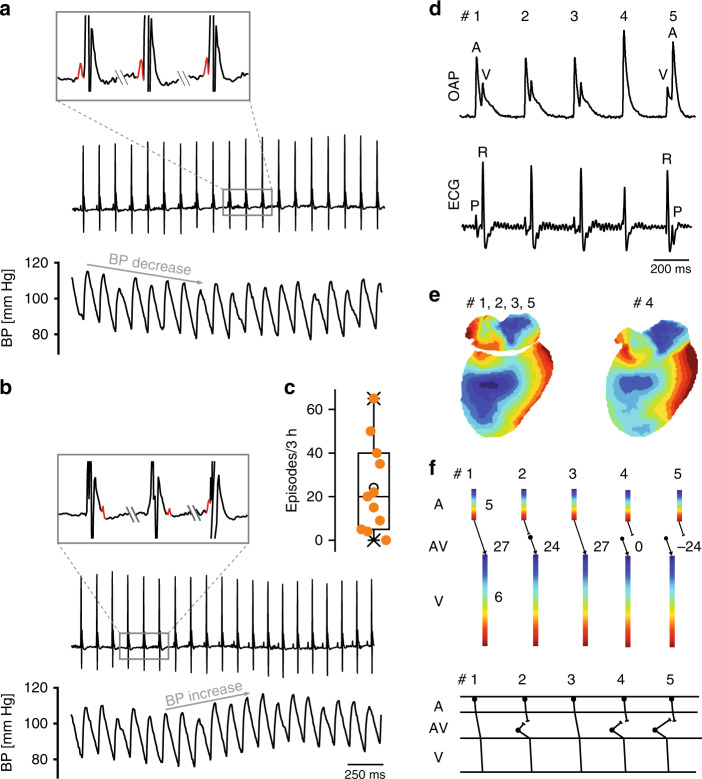
Fig. 9. Isorhythmic AV dissociation (IAVD) due to chronotropic incompetence of the HCN4FEA SAN.
a, b Telemetric ECG trace (top) and corresponding arterial blood pressure recordings (bottom) from a male HCN4FEA mouse during IAVD. Characteristic flirtatious P waves indicate the presence of two independent pacemakers (top and inset). Concomitantly with the successive decrease in PR intervals, blood pressure dropped (bottom). b (top and inset) The P wave is hidden within the QRS complex, located behind or before the QRS complex. Blood pressure starts to normalise when PR normalises (bottom). c Number of IAVD episodes during 3 h in low activity phase (n = 11 HCN4FEA animals). d OAPs and surface ECG recorded from a female HCN4FEA whole-heart preparation during IAVD. e (left) Activation maps of beat #1 determined from the recordings presented in d showing IAVD ex vivo. Activation maps for beats 1, 2, 3, and 5 were similar. Right: activation map of beat #4. f Ladder diagrams for beats #1–5. Beat #1 and 3: normal activation arising from SAN with regular and constant PR; beat #2, 4, and 5: IAVD with shortened or negative PR indicating that the atria are activated by SAN and ventricles by a subsidiary pacemaker close to the AV junction. Schematic ladder diagrams were determined from the measurements shown in d, e. Boxplots show the median line, perc 25/75, and min/max value; open symbols represent the mean value. Source data are provided as a Source Data file.

