Figure 2.

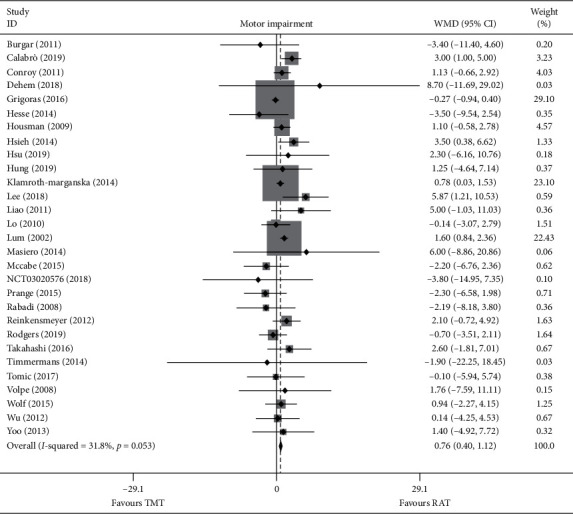
Forest plot of RAT vs. TMT on motor impairment. The each grey area is proportional to the study's weight in the meta-analysis. The overall effect is represented on the plot as a dashed vertical line and the downmost diamond.

Forest plot of RAT vs. TMT on motor impairment. The each grey area is proportional to the study's weight in the meta-analysis. The overall effect is represented on the plot as a dashed vertical line and the downmost diamond.