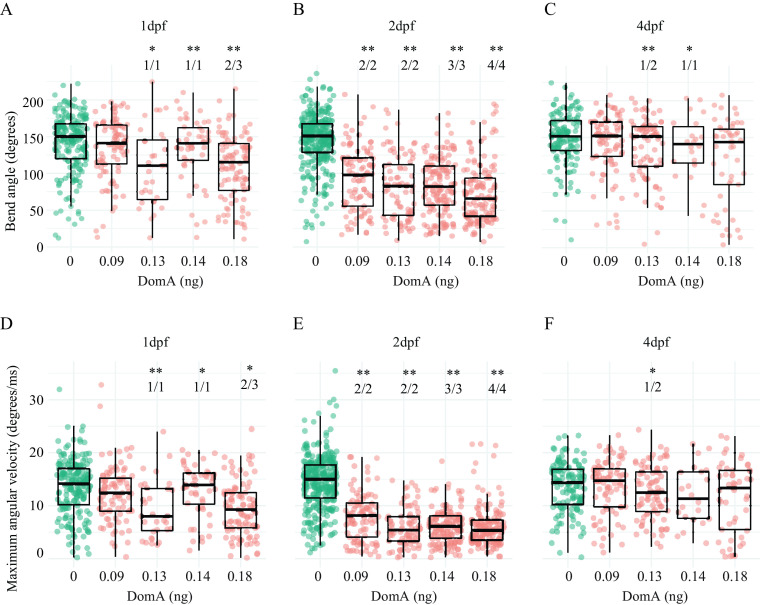
Figure 4.
Kinematics for long latency C-bend (LLC) startles in zebrafish exposed to domoic acid (DomA) at 1, 2, and 4 d postfertilization (dpf). Fish were exposed to different doses of DomA at (A,D) 1 dpf, (B,E) 2 dpf, and (C,F) 4 dpf, and startle responses were measured at 7 dpf. LLC startle responses were characterized by (A–C) bend angle and (D–F) maximal angular velocity. Each point represents the median of up to seven responses for an individual fish. Box plots show the group medians, upper 75% quantiles, and lower 25% quantiles. Significance was determined using Behrens-Fisher -tests (for trials with one DomA dose) or using nonparametric multiple comparison procedures with Dunnett-type contrasts (for trials with multiple DomA doses), Asterisks represent statistical significance between DomA and controls within a single trial. (*, ; **, ). The numbers shown above each column represent the number of trials with statistically significant treatment effects/the total number of trials conducted. Tables S12, S15, and S17 contain the results from the statistical analysis for 2 dpf-, 1 dpf-, and 4 dpf-injected fish, respectively. Table S13 includes medians and interquartile ranges for 2 dpf-injected fish.

