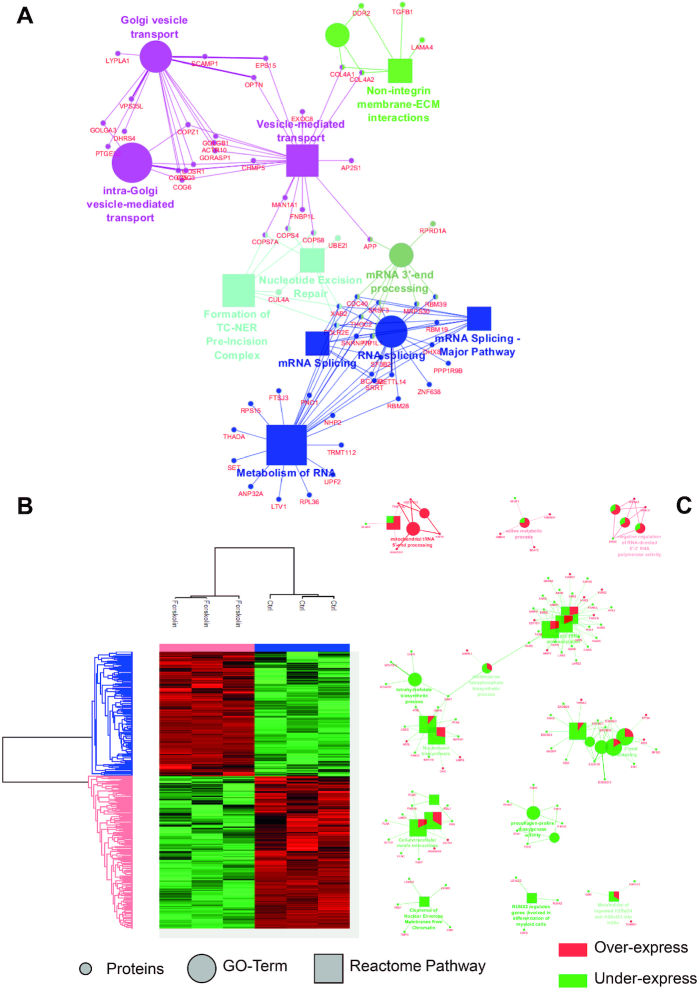
Figure 1.
Identified proteins and their related signalling pathways from NCH82 glioma total cells with and without Forskolin stimulation. (A) GO terms and signalling pathways associated with the proteins identified as unique to the Forskolin-treated cells. (B) Heat map representation generated after raw nLC–MS/MS data interrogated by MaxQuant with LFQ and further processed in Perseus using a t-test showing the proteins over- and underexpressed under Forskolin treatment. (C) GO terms and signalling pathways associated with the over- and underexpressed proteins (Cytoscape; ClueGo app). In Cytoscape, the proteins overexpressed under Forskolin stimulation are represented in red and the underexpressed ones in green.

