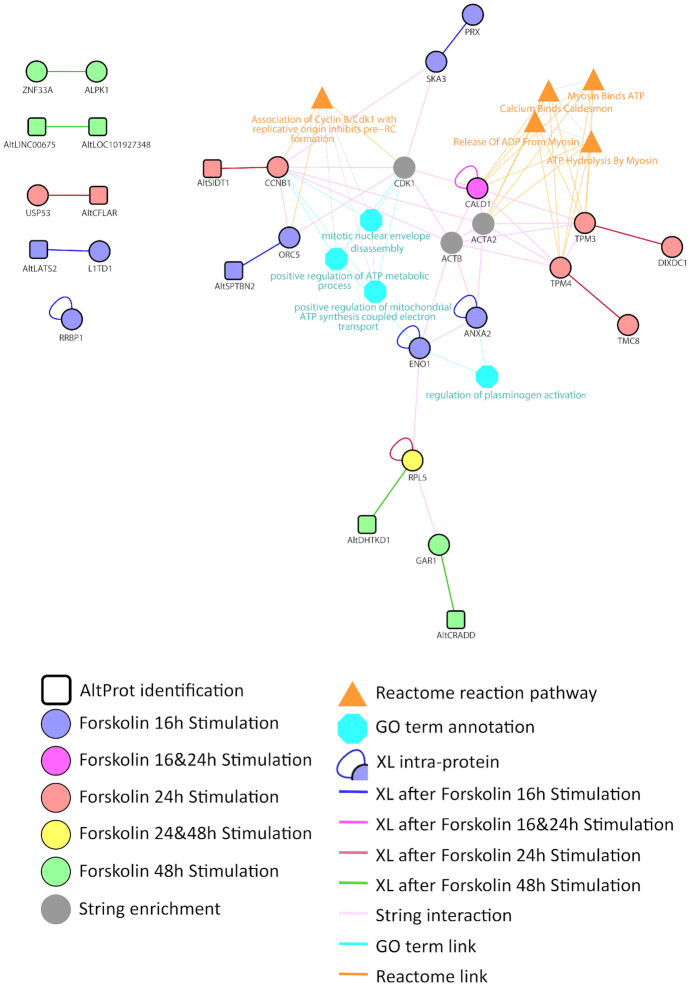
Figure 5.
Network of proteins and their associated GO terms generated from the XL-MS data and enriched from STRING and known pathways for the NCH82 cell nucleus fraction upon time-course treatment by Forskolin for 16 h (purple), 24 h (red) and 48 h (green). The proteins are depicted in the colour according to the time point at which they were observed. Data were interrogated using a combined database between RefProts and AltProts. Circles correspond to the identified RefProts and squares to the AltProts. The networks were enriched through addition of STRING network to the identified RefProts using ClueGO application on Cytoscape.

