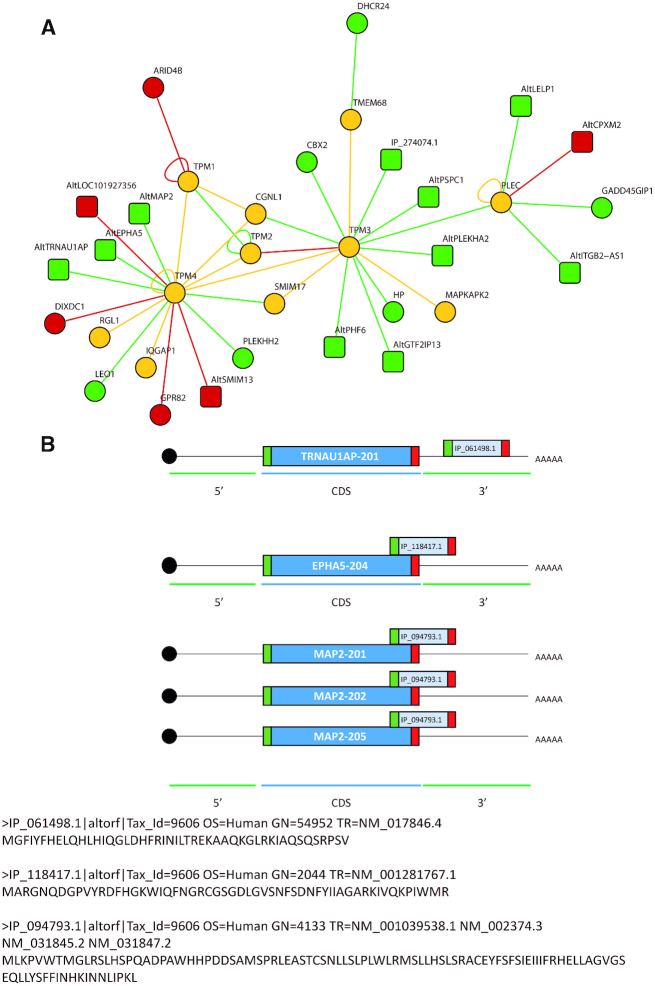
Figure 8.
(A) Focus on the TPM protein network and the different PPIs found by the XL-MS experiment from the NCH82 glioma cell nucleus fraction upon 48 h stimulation with Forskolin versus untreated cells. In green are represented the proteins only found in the untreated condition, in red the overexpressed ones after 48 h Forskolin treatment and in yellow those observed in both conditions. The circles are the RefProts and the squares the AltProts. Interaction maps are generated from XL-MS experiments performed in triplicates (set of files N0, N1, N2, N3). The triplicates were grouped together to identify the significant interactions. (B) Representation of the AltORF encoding for the AltProts interacting with TPM4 location on the mRNA. AltTRNAU1AP is templated on the 3′UTR of the transcript 201 coding for TRNAU1AP. AltEPHA5 coding sequence is located on the overlapping region between the CDS and the 3′UTR region of the transcript 204 coding for EPHA5. AltMAP2 is encoded on the overlapping region between the CDS and the 3′UTR for the three transcripts 201, 202 and 203 coding for MAP2.

