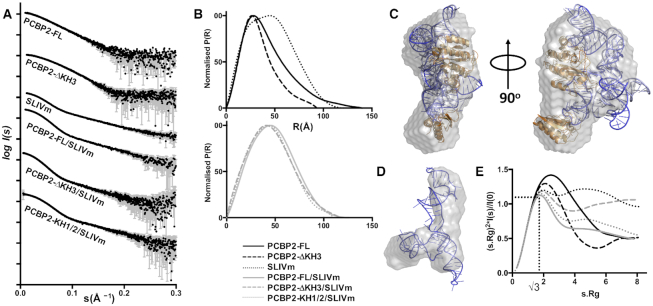
Figure 2.
SAXS analysis of PCBP2 and SLIVm constructs before and after complex formation. (A) Experimental scattering profiles of PCBP2 constructs, SLIVm and PCBP2/SLIVm complexes, obtained by plotting the log of scattering intensity [log I(s)] as a function of forward scattering vector in the units of Å−1 and represented by black circles along with gray error bars showing the mean ± SD; (B) pairwise distribution [P(r)] profiles obtained from the scattering data by plotting P(r) as a function of r in the units of Å; (C) ab initio shape reconstruction derived for the PCBP2-FL/SLIVm complex using DAMMIF (NSD = 0.063) and represented as a grey envelope superposed with the cryoEM derived model; (D) ab initio shape reconstruction derived for SLIVm alone using DAMCLUST (NSD = 0.83) and represented as a grey envelope superposed with the cryoEM derived model. (E) normalized Kratky profiles derived from the scattering data.

