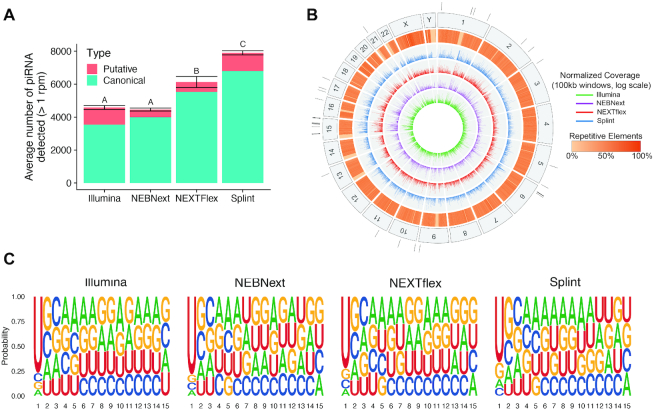
Figure 6.
piRNAs detected in human testes. (A) Number of piRNA detected at an RPM > 1, by each method in human testes. Values represent the average ± standard deviation of 2–4 technical replicates per method. Letters represent groups that are significantly different from each other with a Tukey corrected P-value < 0.001. (B) Circos plot representing piRNA mapping on the human genome. The outermost track represents the human chromosome numbers with black tick marks showing the locations of piRNA clusters identified in at least three of the methods. The inner five tracks were broken up into 100 kb non-overlapping windows. The second outermost track represents the percentage of each window containing repetitive elements such as retrotransposons. The 4 innermost tracks represent the number of piRNA mapping within each window, normalized by the number of times they mapped to the genome and plotted on a log scale. Each method is represented by its own track with the Illumina as the innermost track, followed by NEBNext, NEXTflex and randomized splint. (C) SeqLogo plots showing the sequence motifs for the piRNA species detected by each method.

