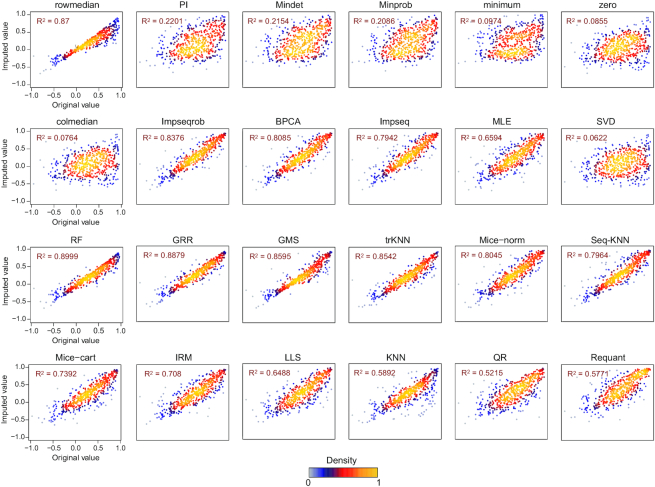
Figure 4.
Across sample, quantitative correlation coefficients obtained by different NA imputation methods. Comparisons of original values and imputed values of the quantitative correlation coefficients are shown which are derived under ACC_Charge criterion by the 23 imputation methods and ‘Requantification’ method for the pepSWATH dataset. The adjusted R squared (R2) of each result was also obtained by ‘lm’ function and shown for every imputation method.‘Requant’ denotes ‘Requantification’ method in OpenSWATH software.

