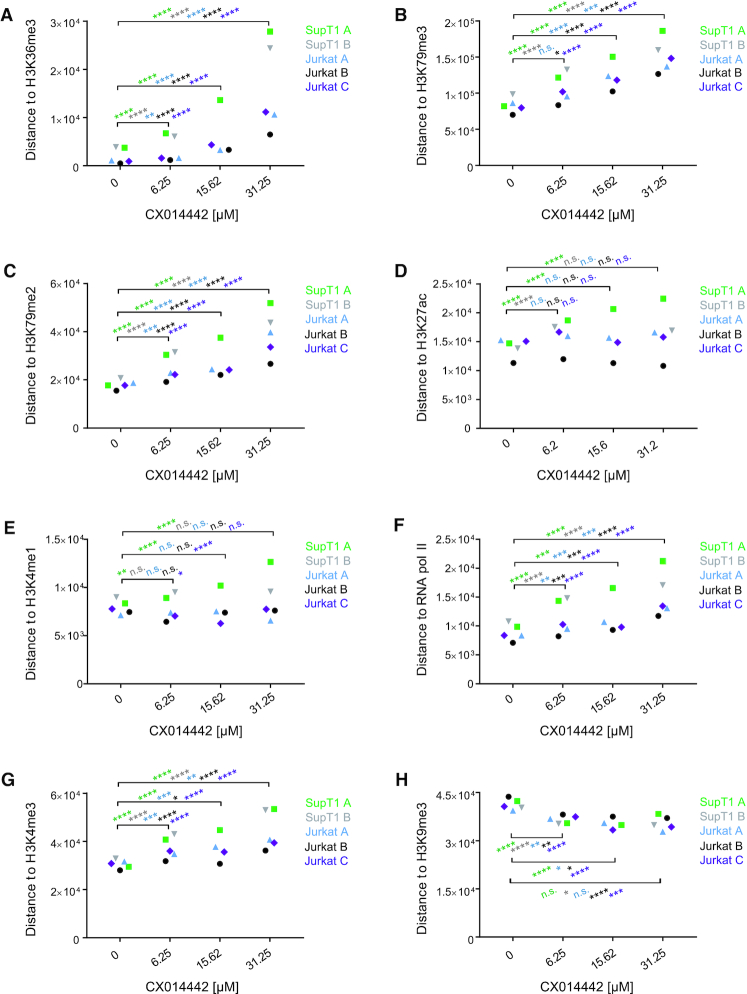
Figure 3.
LEDGIN treatment retargets integration away from H3K36me3 in SupT1 and Jurkat cells. The median distance in base pairs (bp) between the integration site and certain features is plotted for two experiments in SupT1 cells and three in Jurkat cells. Panels A-H plot the distance to: (A) H3K36me3, (B) H3K79me3, (C) H3K79me2, (D) H3K27ac, (E) H3K4me1, (F) RNAPII, (G) H3K4me3 and (H) H3K9me3 (See also Supplementary Table S3 for explanation of different markers). Statistical significance was calculated by the Kruskal–Wallis test, * P< 0.05, ** P< 0.01, *** P< 0.001, **** P< 0.0001. RNAPII; RNA polymerase II.

