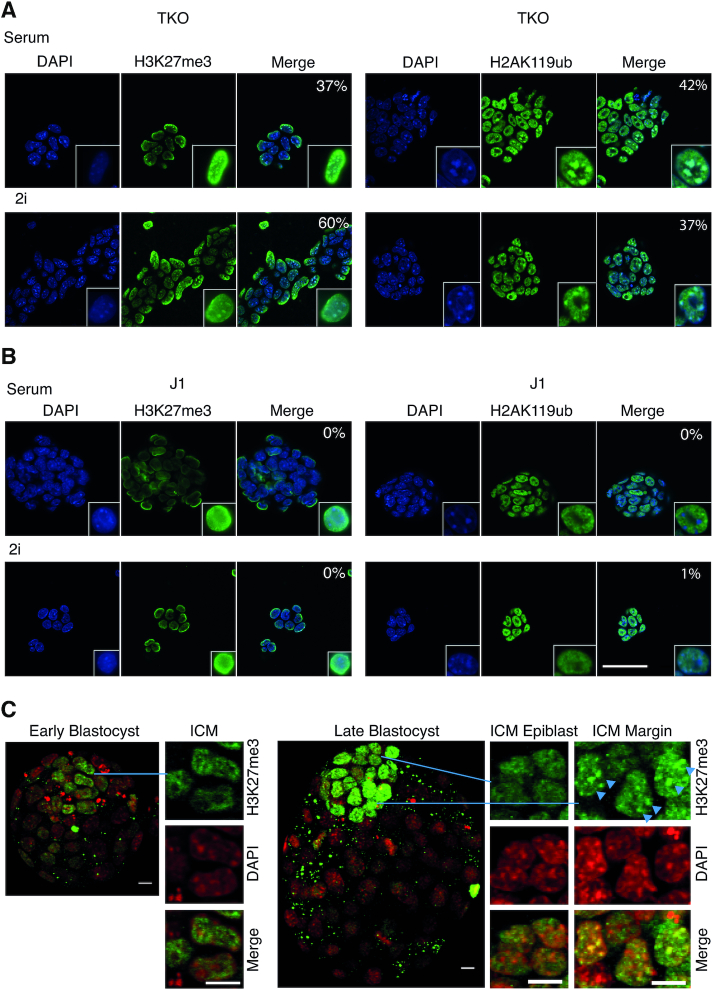
Figure 2.
Epigenetic state of heterochromatin in mESCs and H3K27me3 dynamics during mouse blastocyst development. (A, B) ICC of H3K27me3 (green) and H2AK119Ubiquitin (green) in indicated cells with DAPI (blue) and merge (turquoise represents overlapping signal). White outlined nuclei are ‘zoomed in’ images of representative nuclei. Numbers represent the percentage of cells where green foci overlap with DAPI stained heterochromatin. Scale bar 50 μm. (C) ICC for H3K27me3 (green) with DAPI (pseudocoloured red). Whole and part embryo confocal projections and highlighted cells from the inner ICM and the ICM margin (yellow represents overlapping signal), as indicated; scale bars 10 μm. Arrowheads indicate three cells showing heterochromatic H3K27me3 staining.

