Figure 3.
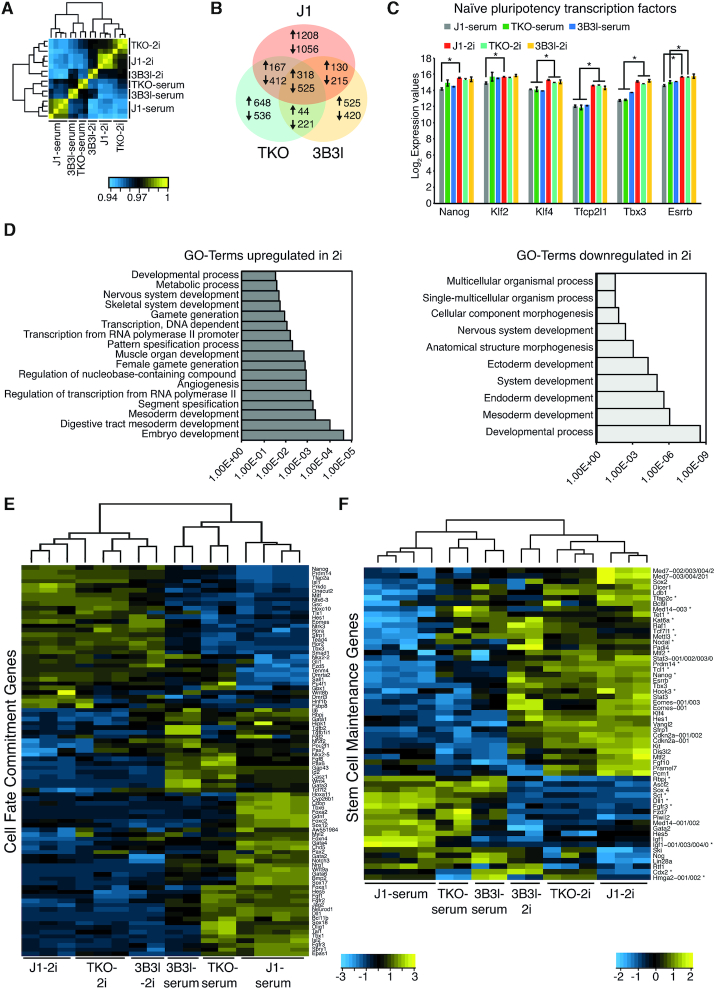
Gene expression changes in mESCs upon culturing in 2i. (A) Heatmap showing Pearson correlation and clustering of microarray data for indicated cell lines and culture conditions. (B) Venn diagram showing the number of genes changing in expression (FC ≥ 2, P.adj. ≤ 0.05 eBayes (limma), Benjamini–Hochberg corrected) in J1-2i (red), TKO-2i (green) and 3B3l-2i (yellow) compared to their serum counterparts. (C) Log2 expression values of indicated genes in mESCs in serum and 2i. Bars represent mean ± SD. * indicates P < 0.05 (unpaired t-test). (D) GO-Term analysis showing genes up- or down-regulated in J1, TKO and 3B3l mESCs. (E), Heatmap representing expression levels of ‘Cell Fate Commitment’ genes differentially expressed (FC ≥ 1.5, p.adj. ≤ 0.05 eBayes (limma), Benjamini-Hochberg corrected) in J1-2i compared to J1-serum in indicated cells. * marks genes which are differentially expressed (FC ≥ 2, P.adj. ≤ 0.05 eBayes (limma), Benjamini–Hochberg corrected) between TKO-serum and J1-serum. (F), Same as E for ‘Stem Cell Maintenance’ genes.

