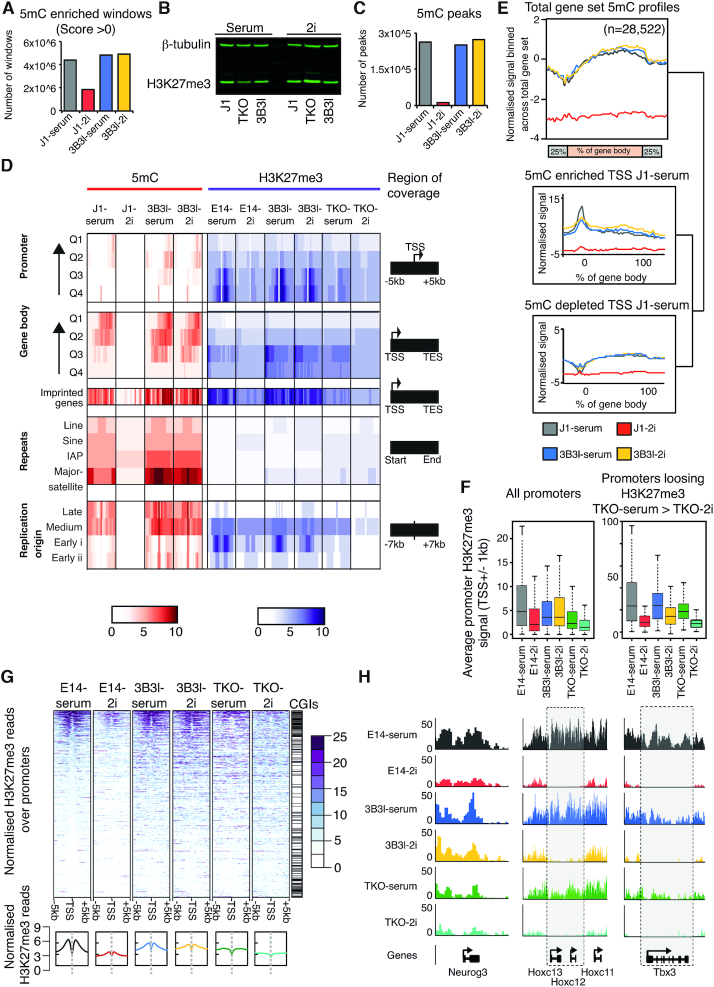
Figure 4.
5mC and H3K27me3 modifications in J1, 3B3l and TKO mESCs in serum and 2i. (A) Windows enriched in 5mC relative to input sequence for indicated cell lines and conditions. (B) Fluorescent western blot of whole cell protein extracts showing levels of H3K27me3 for indicated cell lines cultured in serum or 2i. β-tubulin was used as a loading control. (C) Total number of 5mC peaks (see materials and methods) for indicated cell lines and conditions. (D) Heatmap indicating 5mC (red) and H3K27me3 (purple) levels; 0–10, see scale, for indicated cell lines and conditions across indicated genomic features, covering regions as described. Q4-Q1 indicates low to high gene expression. (E) Sliding window analysis of average genic 5mC patterns across indicated cell lines. Plots represent length normalised gene bodies with flanking regions (±25% of total gene length). Stratification of genic patterns by promoter 5mC enrichment (upper box) or depletion (lower box). Numbers of genes per set are shown above. (F) Boxplots representing average H3K27me3 signal on promoters (±1 kb from TSS) for all promoters or promoters preferentially losing H3K27me3 in TKO-2i relative to TKO-serum. * indicates P < 0.05 (Wilcoxon test). (G) Heatmap representing normalised H3K27me3 reads across promoters (±5 kb TSS). Bottom graphs represent averaged profiles. Heatmaps are ranked by E14 serum levels. (H) Examples of H3K27me3 pattern across Neurog3, Hoxc13, 12, 11 and Tbx3 for indicated cell lines and culture conditions.

