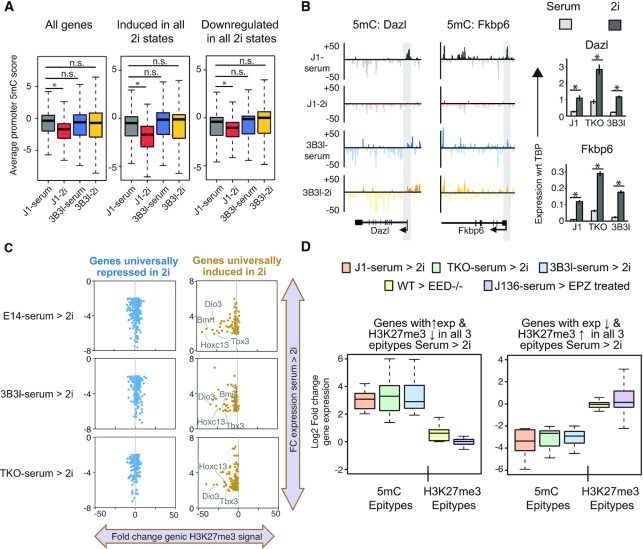
Figure 5.
Epigenetic changes over transcriptionally altered genes in mESCs in serum and 2i. (A) Boxplots of average promoter 5mC in indicated cell lines over the total gene set, genes expressed under 2i conditions and genes repressed under 2i conditions. * indicates P < 0.05 (Wilcoxon test). (B) Examples of 5mC data at the promoters of the methylation regulated genes Dazl and Fkbp6 alongside RT-qPCR data for serum and 2i conditions. Promoter regions are marked by grey shadows. Barcharts show expression analysis of indicated genes by RT-qPCR, values represent mean ± SD of expression with respect to (wrt) TBP. * indicates P < 0.05 (unpaired t-test). (C) Scatter plot of fold change in expression 2i-serum (y-axis) versus fold change in average genic H3K27me3 levels (2i-serum) in WT (left), 3B3l (centre) and TKO (right) cells. Yellow = 2i induced genes, blue = 2i repressed genes. (D) Boxplot detailing expression changes serum to 2i (log2 fold changes) across WT, TKO, 3B3l, Eed−/− and EPZ6438 treated Dnmt1tet/tetmESCs. Left: genes with overlapping H3K27me3 loss/expression gain in J1/TKO/3B3l mESCs. Right: genes with overlapping H3K27me3 gain/expression loss in J1/TKO/3B3l mESCs.

