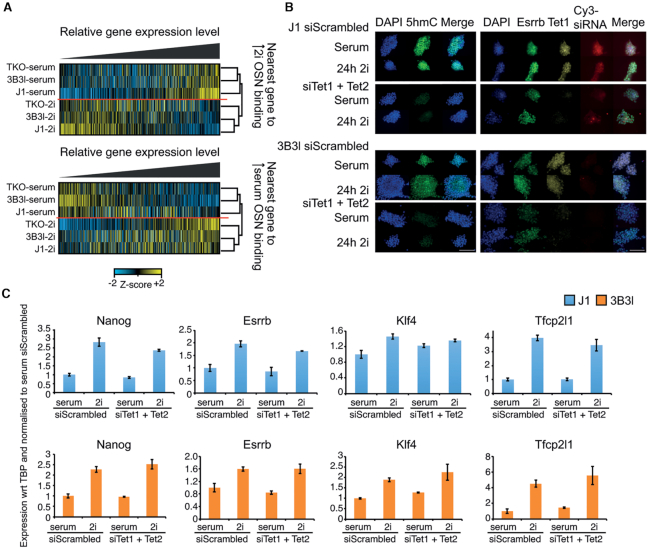
Figure 6.
Relationship between, gene regulatory networks, epigenetic marks and culture conditions in mESCs. (A) Z-score normalised heatmaps ranked by relative expression level of the nearest gene to an OSN binding site (within ±10 kb) with increased binding in 2i (top) or increased binding in serum (bottom) for indicated cell lines. Hierarchical clustering groups by culture condition. (B, C) siRNA knockdown of Tet1 and Tet2 for indicated cell lines. (B) Immunocytochemistry for indicated cell lines. Scale bar is 100μm. Left: DAPI (blue), 5hmC (green) and merge. Right: DAPI (blue), Esrrb (green), Tet1 (yellow), Cy3-siRNA (red) and merge. (C) Expression analysis of indicated genes by RT-qPCR in J1–36 (blue) and 3B3l (orange) mESCs in 72 h serum or 48 h serum + 24 h 2i transfected with either scrambled siRNA or siRNAs for Tet1 + Tet2. Values represent mean ± S.D. of three technical replicates with respect to (wrt) to the housekeeping gene TBP (TATA Binding Protein), normalized to serum siScrambled values.

