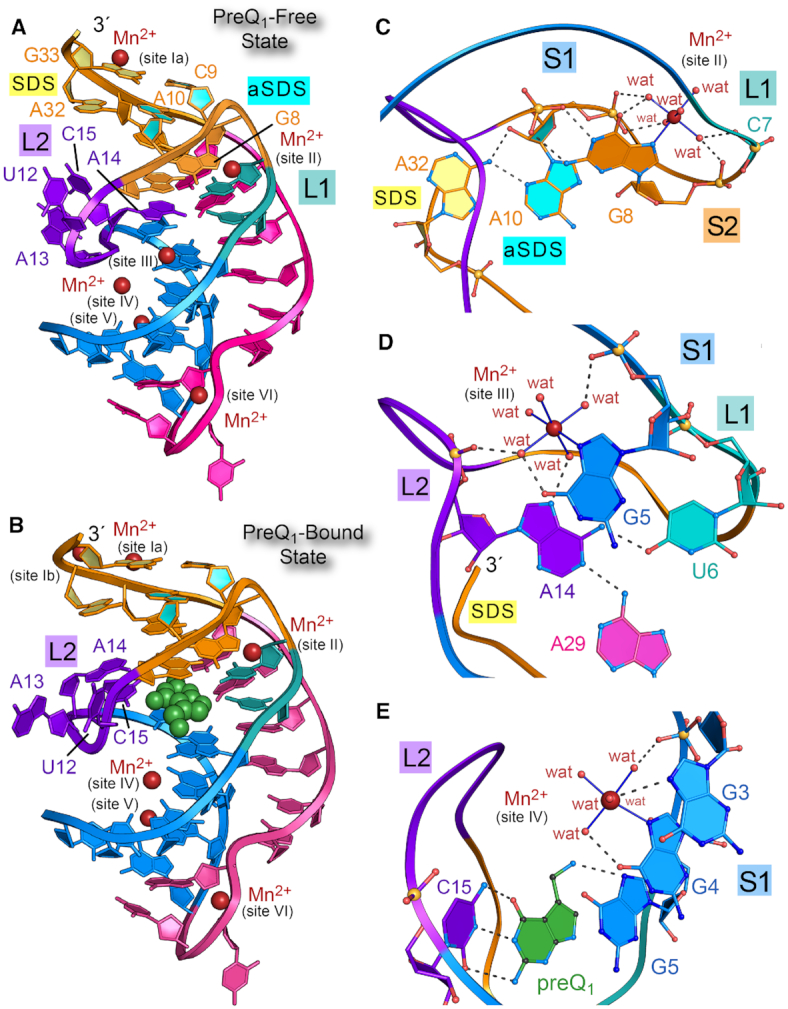
Figure 2.

Ribbon diagrams of the preQ1-free and preQ1-bound states of the Tte preQ1-I riboswitch and select Mn2+ binding sites. (A) Ribbon diagram depicting the H-type pseudoknot fold of the preQ1-I riboswitch based on the preQ1-free Tte crystal structure of this investigation. Six Mn2+ binding sites (maroon spheres) are labeled. Structural elements are colored and labeled as in Figure 1. (B) Ribbon diagram of the preQ1-bound co-crystal structure from this investigation; preQ1 is depicted as a CPK model (green); the site Ib ion is observed only in the preQ1-bound state. (C) Ball-and-stick and ribbon diagram depicting the site II Mn2+ ion, which binds similarly in the preQ1-free and bound-state structures. Water molecules are denoted by wat. (D) Diagram depicting the site III Mn2+ ion, which is compatible with the preQ1-free conformation. (E) Diagram depicting the site IV Mn2+ ion, which is compatible with both free and bound-state conformations.
