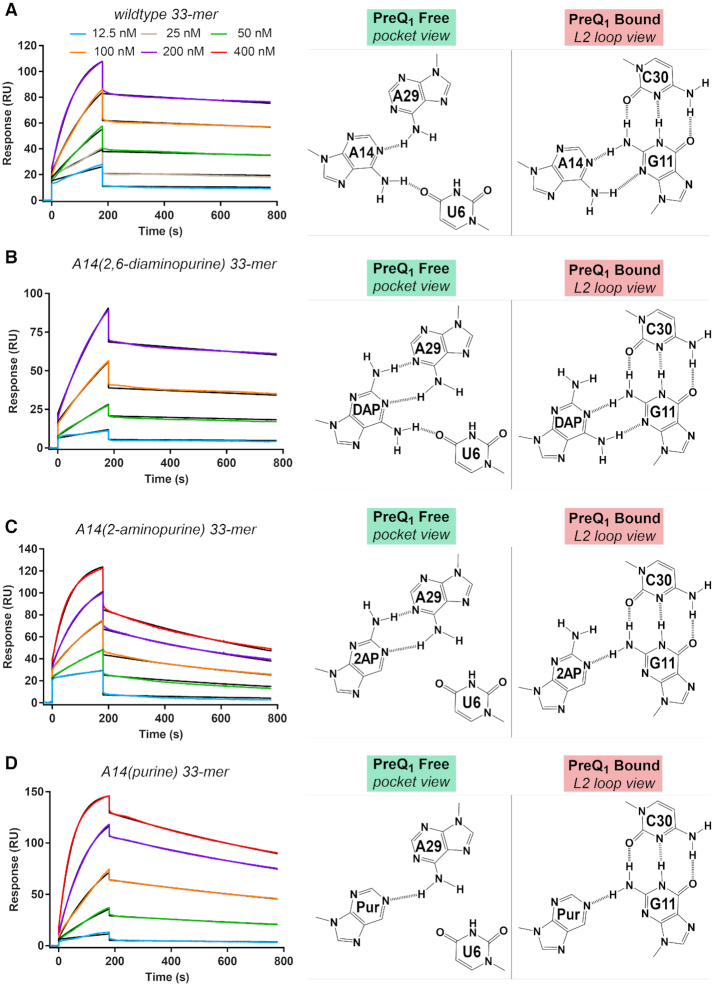
Figure 4.
Kinetic and affinity analysis of preQ1 binding by the wildtype Tte riboswitch and position 14 variants. (A) Representative sensorgrams from surface plasmon resonance (SPR) showing preQ1 association and dissociation to the wildtype riboswitch. Hydrogen-bonding diagrams for A14 are depicted for the effector-free state (binding pocket view) and preQ1-bound state (L2 loop view) based on the crystal structures of this investigation (Figure 2A and B). PreQ1 concentrations are shown in the key and colored lines represent background-subtracted data; black lines indicate the global fit to a 1:1 binding model. The chi2 (RU2) for the fit was 1.8. The kon and koff rates and the apparent KD values are in Table 2. (B) Representative sensorgrams for preQ1 interaction with the A14(DAP) (2,6-diaminopurine) variant. The chi2 (RU2) for the fit was 0.81. Putative hydrogen-bonding interactions for A14(DAP) are depicted for the effector-free state (binding pocket view) and preQ1-bound state (L2 loop view) based on the wildtype crystal structures of this investigation. (C) Representative sensorgrams showing preQ1 interactions with the A14(2AP) (2-aminopurine) variant. The chi2 (RU2) for the fit was 1.5. Putative hydrogen-bonding interactions for A14(2AP) are depicted. (D) Representative sensorgrams showing preQ1 interactions with the A14(Pur) (purine) variant. The chi2 (RU2) for the fit was 0.85. Putative hydrogen-bonding interactions for A14(Pur) are depicted.

