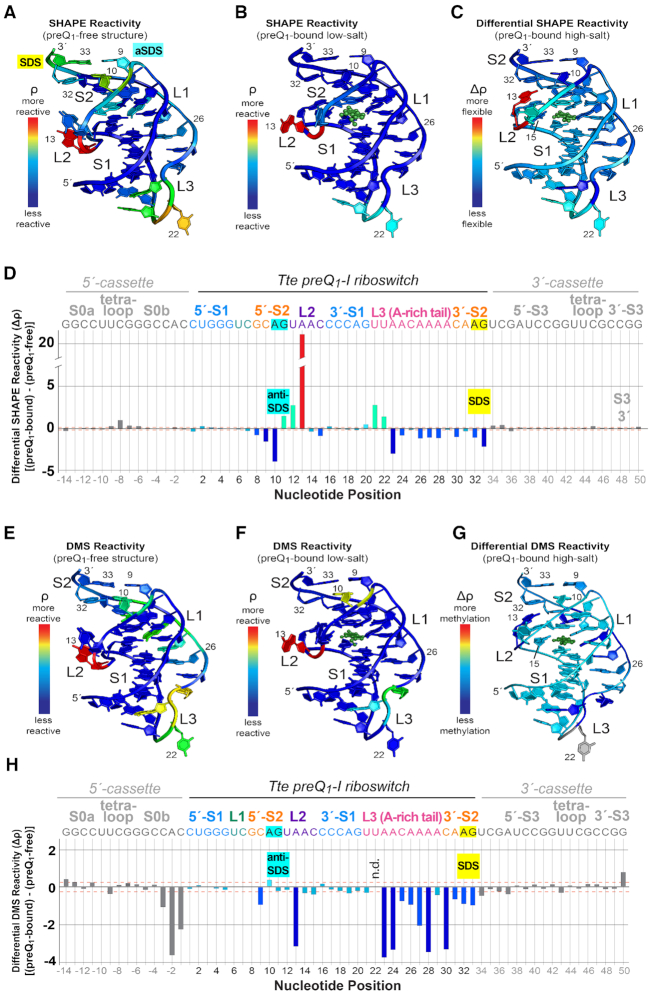
Figure 6.
Structural mapping of preQ1-dependent 2′-hydroxyl group acylation and base methylation for the Tte riboswitch. (A) SHAPE-seq reactivity (ρ) values mapped onto the preQ1-free crystal structure (Figure 2A). (B) SHAPE-seq reactivity (ρ) values mapped onto the preQ1-bound structure (Figure 2B). Here and elsewhere, preQ1 is shown as a green ball-and-stick model but no reactivity values were measured (C) Differential SHAPE reactivities mapped onto the preQ1-bound high-salt structure (PDB entry: 3q50) (22). The differential reactivity key is: light blue means little or no flexibility change between preQ1-free and bound states; red equals the greatest increase in flexibility with added preQ1; dark blue equals the largest decrease in flexibility with added preQ1. (D) Plot of differential SHAPE reactivity (Δρ) versus sequence position. The Tte riboswitch sequence encompasses nucleotides 1–33. Nucleotides on the 5′- and 3′-ends were derived from a folding cassette (52). The Δρ values were mapped to the structure in panel C. Here and elsewhere canonical helical regions in the cassette and riboswitch (i.e. S0, S1 and S3) were used to calculate standard deviations of Δρ; these are drawn as orange, dashed lines to indicate signal-to-noise thresholds. The colors of the bars match the colors of the corresponding base in panel C. Bars corresponding to bases in the folding cassette (see Materials and Methods) are colored gray. (E) DMS-seq ρ values mapped onto the preQ1-free crystal structure (Figure 2A). (F) DMS-seq ρ values mapped onto the preQ1-bound structure (Figure 2B). (G) DMS Δρ mapped onto the preQ1-bound high-salt structure (PDB entry: 3q50) (22). The differential reactivity key is: green means little change in Watson-Crick face accessibility between preQ1-free and bound states; red equals the greatest increase in accessibility with added preQ1; dark blue equals the largest decrease in accessibility with added preQ1. (H) Plot of DMS Δρ versus sequence position. The Δρ values were mapped to the structure in panel G. N.d. means not determined. Individual reactivity values are provided in Supplementary Figure S4.

