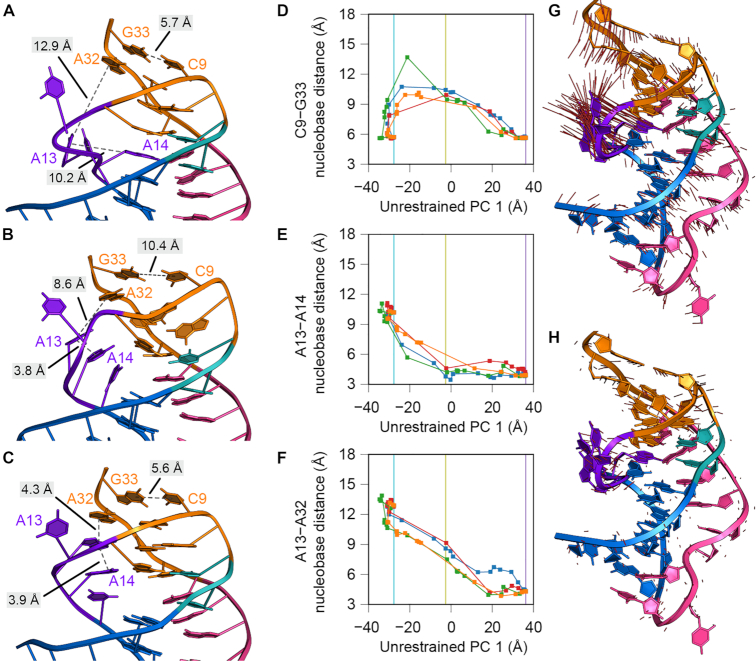
Figure 7.
Atomistic motions associated with interconversion of the Tte preQ1-I riboswitch from the preQ1-free to the preQ1-bound state. (A–C) Images from a representative nudged elastic band (NEB) calculation (blue path in panels D–F) without restraints. The complete trajectory is provided as Supplementary Movie S1. Images shown are: (A) image 1, corresponding to the preQ1-free endpoint, (B) image 9, corresponding to a low-energy intermediate, and (C) image 24, corresponding to the preQ1-bound endpoint. RNA residues are colored as described in Figure 1. Dashed, gray lines represent distances between nucleobases that form either stacking interactions in loop L2 or base pairs in stem S2. (D–F) Nucleobase distances (between the centroids of nucleobase atoms C2, C4, and C6) are plotted as a function of a progress coordinate — the first principal component (PC) from the unrestrained NEB pathway — to facilitate comparison between trajectories. Vertical lines indicate the value of this progress coordinate for the images depicted in panels A–C: cyan for image 1 (A), yellow for image 9 (B), and purple for image 24 (C). Nucleobase distances plotted are (D) C9-G33, representing the breaking of the aSDS-SDS base pairs, (E) A13-A14, representing the formation of the L2 nucleobase stacking interactions, and (F) A13-A32, representing docking of the L2 stacking interactions into stem S2. (G–H) Visualization of the first (G) and second (H) PCs, describing 61% and 23% of the variance, as a projection onto the preQ1-bound endpoint. Red lines represent the direction of the PC eigenvector for every atom. In (H), the magnitude of the red lines is scaled by the relative variances between the second and first PCs (0.38).

