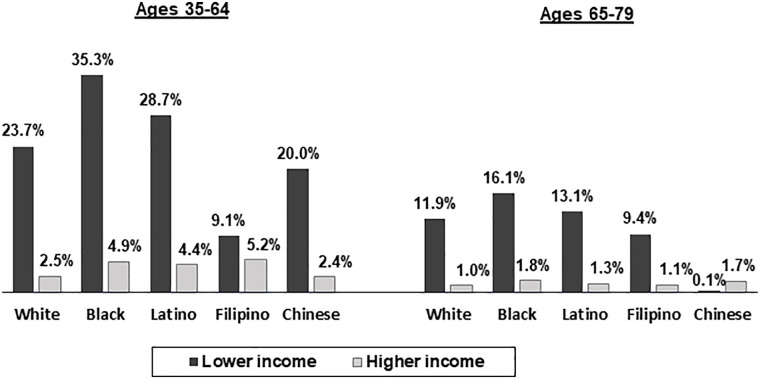
Fig 5. Percentages of adults in lower and higher income categories who in the past year ate less fruits and vegetables than wanted to due to cost, by race/ethnicity and age group.
Lower income:<$35,000; Higher income: ≥ $100,000 for ages 35–64 and ≥ $65,000 for ages 65–79. All percentages are age-sex standardized. Differences between lower and higher income groups for Whites, Blacks, Latinos, and Chinese in the 35–64 age group and for Whites, Blacks, and Latinos in the 65–79 age group are statistically significant at p<.05.

