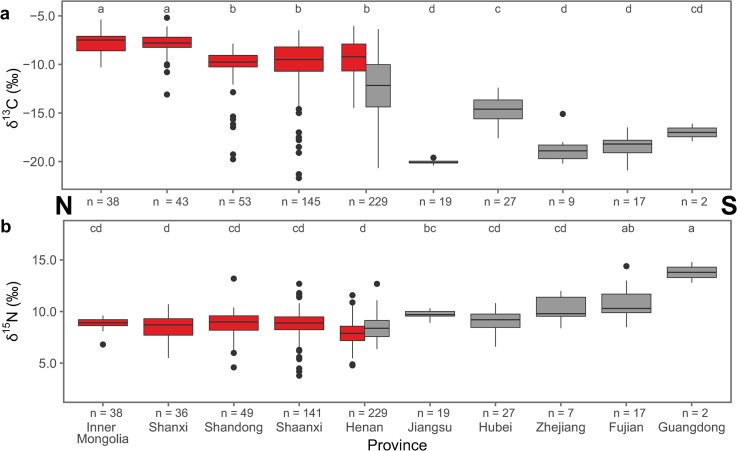
Fig 4. Isotope data by province, 5000–2000 cal BC.
Boxplots of human bone collagen δ13C (a) and δ15N values (b) by province from sites that date to between 5000–2000 cal BC arranged from north (left) to south (right). Regions are differentiated by color: Loess Plateau (red) and Yangtze-Huai (gray). Provinces sharing a letter are not significantly different (Tukey’s HSD). Statistics are summarized in S3A and S3B Table.

