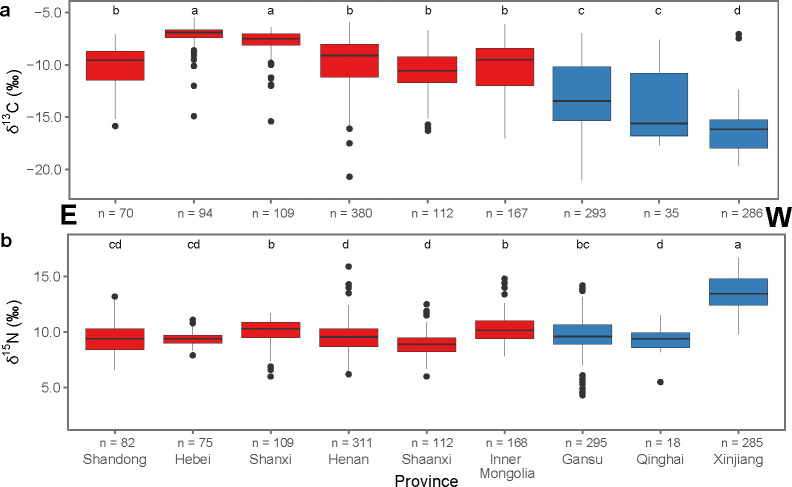
Fig 6. Isotope data by province, post-2000 cal BC.
Boxplots of human bone collagen δ13C (a) and δ15N values (b) by province from sites that date to post-2000 cal BC arranged from east (left) to west (right). Regions are differentiated by color: Loess Plateau (red) and Continental Interior (blue). Provinces sharing a letter do not have significantly different means (Tukey’s HSD). Statistics are summarized in S3C and S3D Table.

