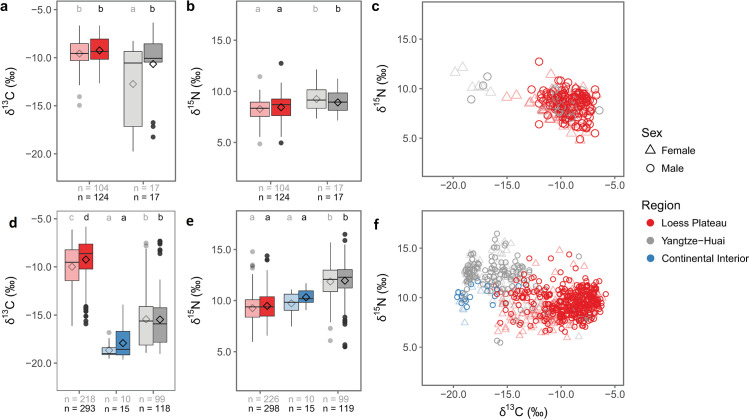
Fig 7. Isotope data by sex.
Boxplots and scatterplots of human bone collagen δ13C and δ15N values by sex from sites occupied between 5000–2000 cal BC (a-c), and post-2000 cal BC (d-f). Regions are differentiated by color and sex by shape and shade (female = lighter shaded, open triangles, male = darker shaded, open circles). Boxplot components are described in Fig 2. N-values listed at the base of the boxplots are divided by female (gray) and male (black). In panels a, b, d, and e, groups sharing a letter do not have significantly different means (Tukey’s HSD). Statistics are summarized in S4A and S4B Table.

