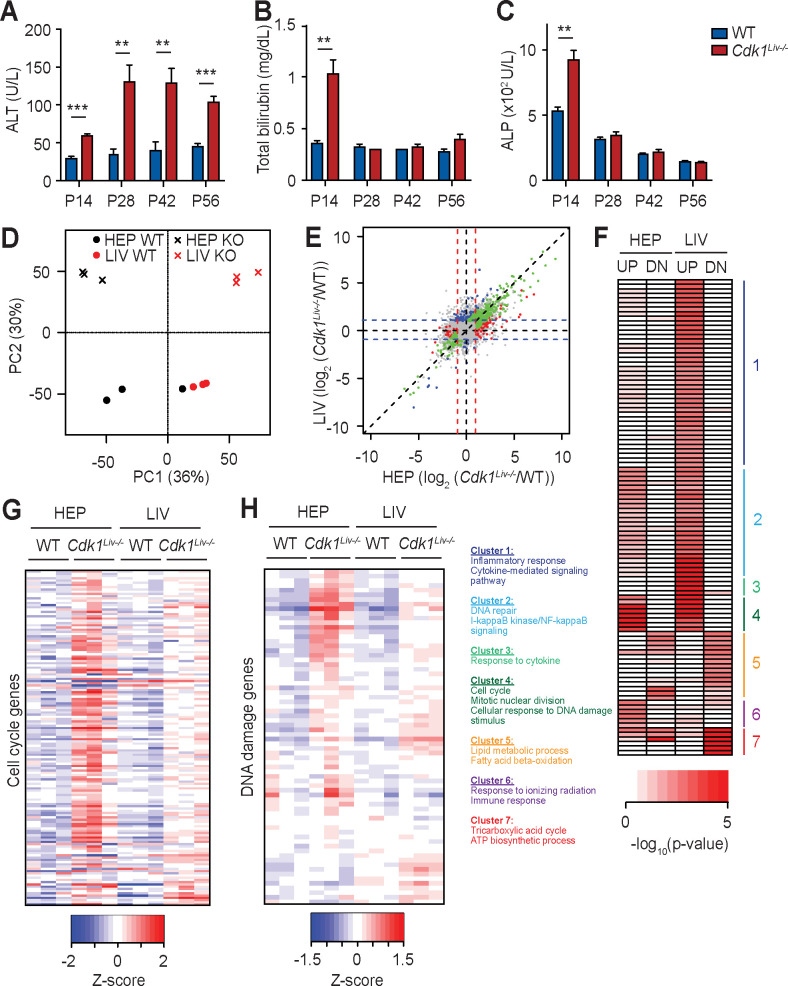
Fig 3. Transcriptomic analysis of Cdk1Liv-/- hepatocytes and whole liver.
Blood test for (A) alanine aminotransferase (ALT), (B) total bilirubin, and (C) alkaline phosphatase (ALP) levels at different post-natal time points (at least n = 5 per genotype per time point). (D) Principal component analysis of RNAseq results, with each dot or cross representing one sample that is either whole liver (LIV) or isolated hepatocyte (HEP) from wild type (WT) or Cdk1Liv-/- (KO) mice. (E) Correlation plot of RNAseq results from whole liver and isolated hepatocytes, with each dot representing one gene that is either not significantly differentially expressed (grey), significantly differentially expressed in whole liver only (blue), in isolated hepatocytes only (red), or in both whole liver and isolated hepatocytes (green). (F) Heat map of gene ontologies of genes up-regulated (UP) or down-regulated (DN) in Cdk1Liv-/- compared to WT samples with representative gene ontologies from each cluster listed. Color scale represents–log10(p-value). (G) Heat map of cell cycle associated genes from RNAseq analysis. (H) Heat map of DNA damage associated genes from RNAseq analysis. Color scales represent Z-score unless otherwise specified. Error bars of all graphs represent S.E.M.

