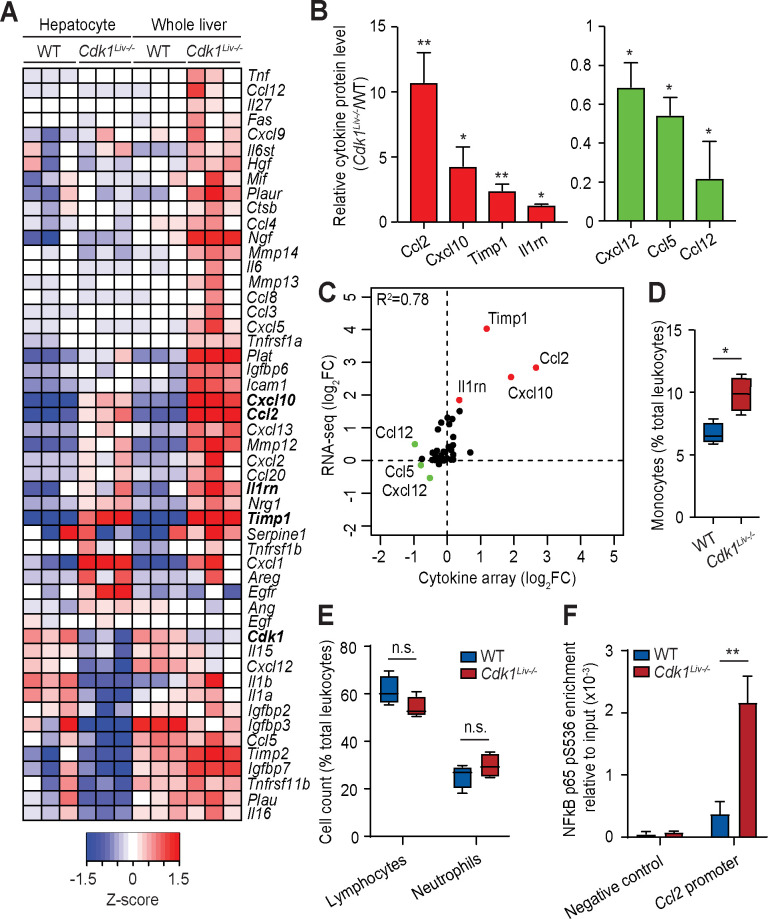
Fig 5. Characterization of the inflammatory response in Cdk1Liv-/- liver.
(A) Heat map of inflammation-associated genes from the RNAseq analysis. Color scale represents Z-score. (B) Cytokine array of lysates from P14 whole liver (n = 3 per genotype). (C) Correlation plot of cytokine levels from the RNAseq analysis and the cytokine array. Whole blood from wild type (WT) and Cdk1Liv-/- mice were analyzed for (D) monocytes, (E) lymphocytes and neutrophils and shown as a percentage (%) of the total number of leukocytes analyzed from the same mouse (n = 4 per genotype). (F) ChIP for NFκB p65 pS536 from lysates of isolated hepatocytes, probing for the Ccl2 promoter by qPCR (n = 3 per genotype). Error bars represent S.E.M.

