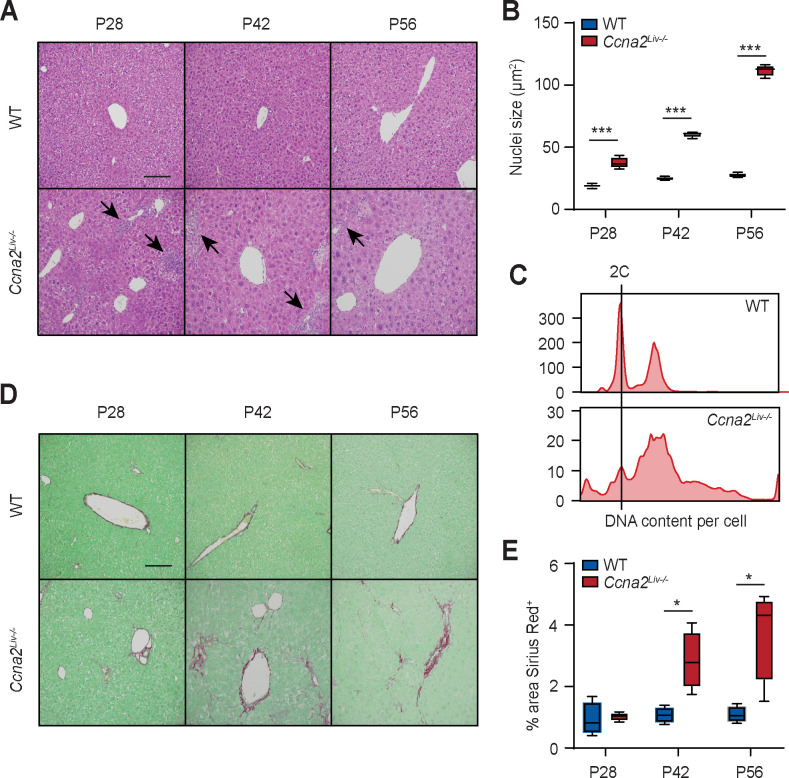
Fig 6. Ccna2Liv-/- liver exhibits hypertrophy and fibrosis.
(A) Representative H&E images of liver sections. Arrows point to areas of immune infiltration. (B) Quantification of nuclei size of hepatocytes using at least 500 hepatocytes per mouse (n = 4 per genotype per time point). (C) DNA content analysis by flow cytometry of propidium iodide-stained hepatocytes isolated from wild type (WT) and Ccna2Liv-/- mice at P84. (D) Representative images of Sirius Red-stained liver sections. (E) Quantification of Sirius Red-stained area using at least 10 images per mouse (n = 4 per genotype per time point). Error bars represent S.E.M.

