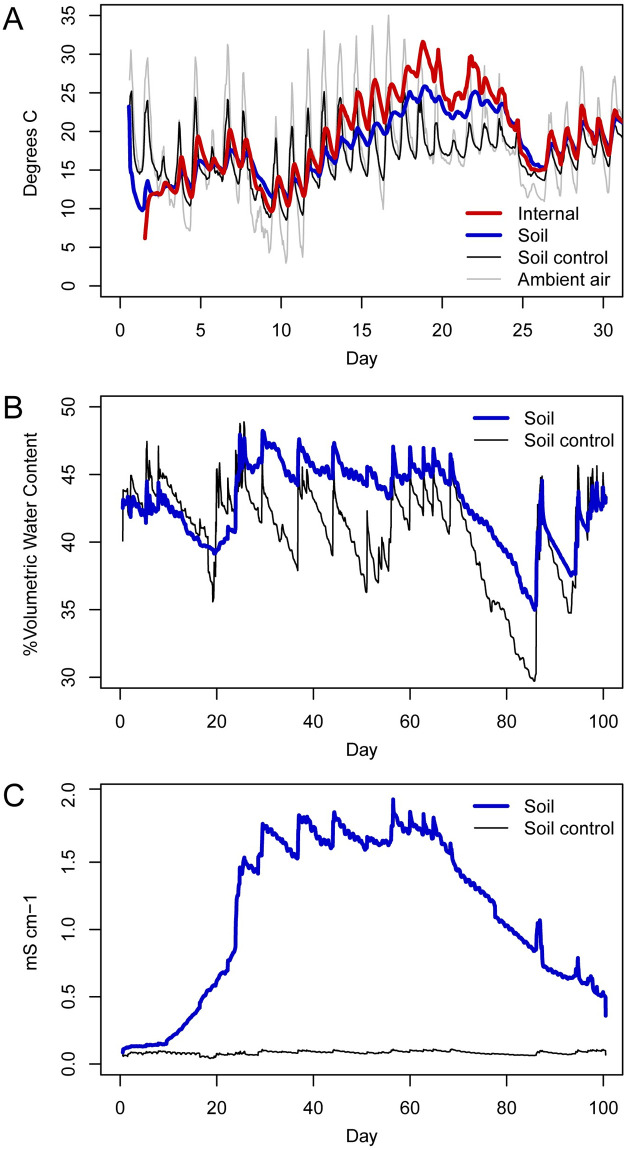
Fig 1. Soil and ambient environmental sensor data.
(A) Mean internal, ambient, and soil temperatures, (B), mean soil moisture, and (C) mean soil electrical conductivity. Internal carcass temperature increased beginning on day 13 and remained elevated until day 25. Soil moisture and electrical conductivity rapidly increased following day 21 and remained elevated until day 95. Decomposition-impacted soils are shown in blue (A-C), soil controls are shown in black (A-C), internal temperatures are shown in red (A), and ambient air temperatures are shown in gray (A).

