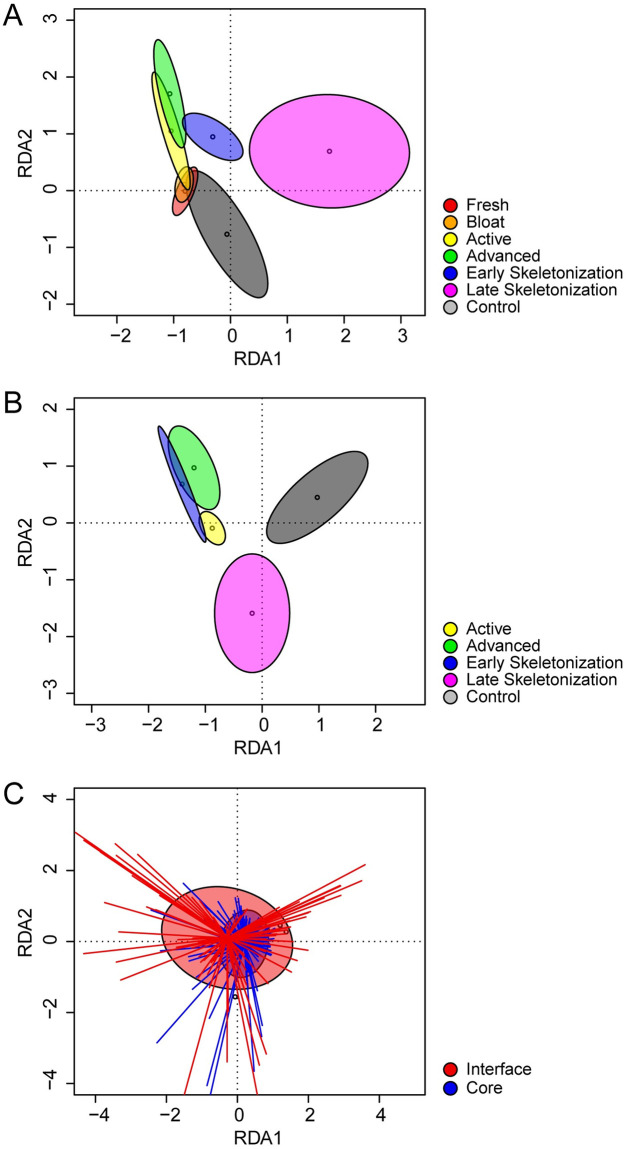
Fig 4. Nematode beta diversity.
RDA biplots of nematode community trajectory during decomposition progression in (A) core (0–30 cm) and (B) interface (0–1 cm) soils. Ellipses represent standard deviations from decay stage centroids. Samples are grouped by morphological decomposition stage. Comparative changes at both soil depths (C) are shown for the entire study. Ellipses represent standard deviations from depth centroids, and spiders show distances from centroids.

