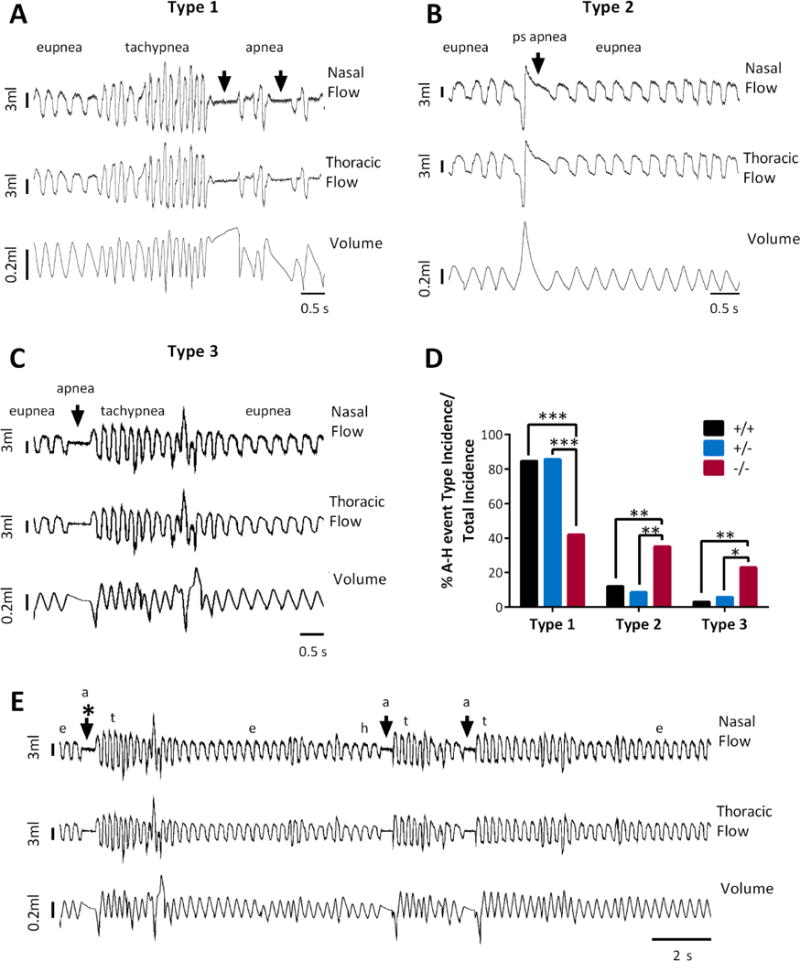
Figure 3. All genotypes display three types of Apnea-Hypopnea events.

(A) An example of a Type 1 event which begins with eupnea, then tachypnea, then apnea or hypopnea. (B) Type 2 events are preceded and followed by eupnea. Shown is an example of a post sigh (ps) apnea. (C) Type 3 events are preceded by eupnea and followed by tachypnea. (D) In comparison to Kcna1+/+ and Kcna1+/− mice, Kcna1−/− mice had decreased Type 1 events and increased Type 2 and 3 events. Significance determined by Fisher’s exact test, * p < 0.05, ** p < 0.01, *** p < 0.001. (E) Example trace of sequential A-H events. Eupnea (e), apnea (a), tachypnea (t). Arrows indicate apnea events. Asterisk indicates the Type 3 event shown in C on a shorter time scale.
