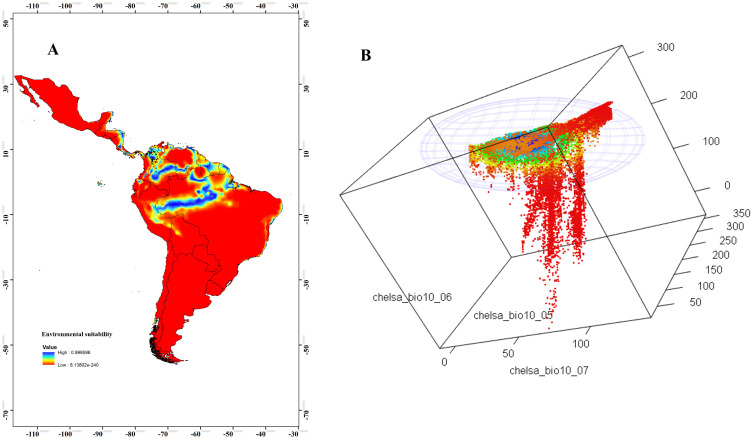
Fig 3. Geographical areas closer to the niche centroid.
(A) Environmental suitability model of Rhodnius pallescens, representing the DNC, with values from 0 (blue) to 1 (red), abundance records are represented in black. (B) Environmental space (MVE). DNC, distance to the niche centroid; MVE, minimum-volume ellipsoid. Bio5 = maximum temperature of the warmest month; Bio6 = minimum temperature of the coldest month; Bio7 = annual temperature range.

