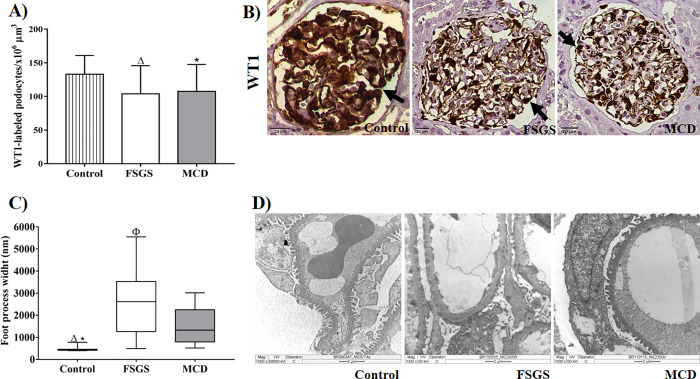
Fig 1. Morphological evaluation of podocytes in renal biopsies of patients with FSGS and MCD.
(A) Density of WT1-labeled podocytes in three groups. ANOVA test followed by Tukey’s multiple comparison test. The bars represent the mean and the vertical lines represent the standard error of the mean. (B) WT1-labeled podocytes in the control, FSGS, and MCD groups (arrows). (C) Difference in the foot process width between control, FSGS and MCD groups showing the extensive foot process effacement in FSGS group. Kruskal-Wallis test followed by Dunn's multiple comparisons test. The horizontal lines represent the medians, bars represent the 25–75% percentiles, and the vertical lines represent the 10–90% percentiles. (D) TEM showing more foot process effacement in a case of FSGS and more foot process preserved in a case of MCD and in a case of control group. Δ: Significant difference between FSGS and control group. *: Significant difference between MCD and control group. Φ: Significant difference between FSGS and MCD group.

