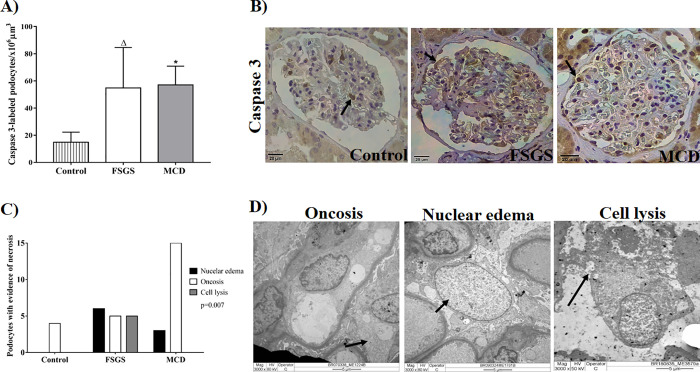
Fig 3. Evidence of cell death in renal biopsy of patients with FSGS and MCD.
(A) Density of podocytes labeled with caspase-3 in three groups. ANOVA test followed by Tukey’s multiple comparison test. The bars represent the mean and the vertical lines represent the standard error of the mean. (B) Caspase 3-labeled podocytes in the control, FSGS, and MCD groups (arrows). (C) Morphological evidence of necrosis in podocytes from control, FSGS and MCD group, indicating a higher number of podocytes with nuclear edema and cell lysis in FSGS cases. Chi-square test. (D) TEM illustrating podocytes (arrows) with morphological alterations compatible with necrosis. Δ: Significant difference between FSGS and control group. *: Significant difference between MCD and control group.

