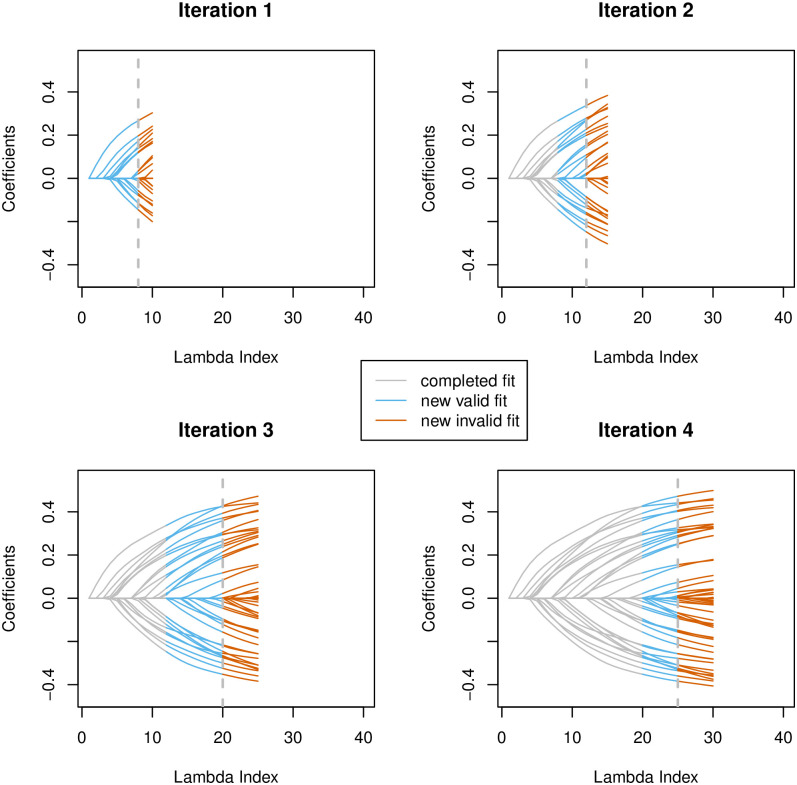
Fig 1. The lasso coefficient profile that shows the progression of the BASIL algorithm.
The horizontal axis represents the index of lambda values, 1 ≤ ℓ ≤ L, which correspond to the sequence of the regularization parameters, λ1 > λ2 > ⋯ > λL. The previously finished part of the path is colored grey, the newly completed and verified is in sky blue, and the part that is newly computed but failed the verification is colored orange. The largest lambda index with the verified model is highlighted with vertical dotted gray line.

